Wednesday, April 20, 2011

Testing Phase 1 complete

48 trades and 2 months later, I think I have completed the 1st phase of my testing this strategy.


Key highlights:

1.37% gain

average risk of only .49%

max drawdown was 2.65% which is probably my worst stat. But it was not because of any one losing trade - I had a series of 6/7 trades that lost in a row.

Also, I paid more than 2% of my account in commissions... is TOS too expensive? You bet!!

In any case, I am fairly satisfied with the results. I know that 2 things must change: my MFE to exit efficiency is a mere 33%. That means I am not capturing the max profit possible. So I am moving my far out target a little closer.

Also, I am getting stopped out way too much on trades that go on to win and win big. So I need to optimize my stop loss a little bit.

Apart from that, I can see, as I thought, around 60% of my trades will be profitable.

A note on the markets

In case you did not know, I am only simulating the above strategy. I am making decent profits trading this strategy on a daily basis. Mostly, I have been lucky and caught both the big down moves on S&P and exited very near the bottom.


Tuesday, March 15, 2011

My Excel Journal

Since March 11th, I have not had a chance to post everyday, but I traded three new trades in that time.
Nothing too exciting happened though. One loss, one breakeven, and one gain. One thing I noticed though, while I was not logging my trades, I was starting to really doubt myself and think "this is not working, I am not making any money, bla bla bla. I should revise my strategy" Actually, I even traded one trade going completely against my strategy (ended up in break even).

But as I sat down today to log all the trades, I noticed that my account position overall changed a mere ~.1% after commissions!! And, clearly I have not been losing - only 1 of the three trades resulted in a loss (and had i followed my method, two would have been wins rather than 1 breakeven). I thought it was very interesting to realize that just the simple act of not logging trades and going into the weekend had me thinking and going off on bad tangents.


Anyway, instead of posting all the trades I logged, I want to share my journal. The format is very similar to Big Mike's journal but I have changed a bunch of things to suit my needs. The data is very limited so some of the stats are a bit skewy (I only wish i was making 76%/year :D ).


Wednesday, March 9, 2011

Trades on 3/9/2011

3/9/2011 Trade 1:

Trade Details:
Long 2 ES contracts at 1319.5
Stop loss 1.25 - 5 ticks- below entry price at 1318.25

Strategy:
If price reaches 1320.5 - 4 ticks - move the stop loss to BE + 1 tick.
Target 1: 1321.25 - 7 ticks - sell 1 contract and set stop loss to 1321.25
Target 2: 1324.25 - 19 ticks - set trailing stop of 5 ticks

Outcome: Stopped out at initial Stop Loss. No biggie.

Exit1-MFE efficiency: 0%
Exit 1- Risk efficiency: -100.00%
MAE: 1
Exit 1 price: 1318.25
Exit 1 Profit: -139


3/9/2011 Trade 2:

Trade Details:
Long 2 ES contracts at 1315.75
Stop loss 2.25 - 9 ticks- below entry price at 1313.5

Strategy:
If price reaches 1317.75 - 8 ticks - move the stop loss to BE + 1 tick.
Target 1: 1319.75 - 16 ticks - sell 1 contract and set stop loss to 1319.75
Target 2: 1325.75 - 40 ticks - set trailing stop of 5 ticks

Outcome:
I am a moron! I accidently put in the wrong order and got out of the trade for 1 contract. Then I did not know what to do with the other contract (lacking a plan!), I put a trailing stop, got stopped out, then saw ES advance 10-15 ticks AFTER TWO YEARS YOU WOULD THINK I CAN PUT IN AN ORDER CORRECTLY!!!!
I would be the idiot who puts a "B" instead of an "M" and causes the next flash crash....

Exit1-MFE efficiency: 100% (obviously this stat is incorrect because MFE was much higher, but the way my journal records it, this showed up. Once I adjust the stats for benchmark, this number will be fixed)
Exit 1- Risk efficiency: 50.00%
MAE: 9
Exit 1 price: 1318
Exit 1 Profit: 105.5

Exit 2-MFE efficiency: 55.56%
Exit 2- Risk efficiency: 27.78%
MAE: 9
Exit 2 price: 1317
Exit 2 Profit: 55.5


Tuesday, March 8, 2011

Finally Starting a New Year with a New Strategy

I can't believe last time I posted was way back in September.
Anyway, it is a new year and time for a new beginning. I have spent the last few months testing and coding the TD indicators in Ninjascript and I think I have finally optimized it to something I can trade consistently. There are some more issues I need to work out but those will be resolved in due time.

A Change in Instrument
I am adopting a new trading style and strategy starting this year. For one, I will move away from options. Reasons:
1. The bid/ask spread is too much on everything but SPY and QQQQ. Even then, a 3-tick bid/ask spread means that any trade I make, I am in the hole $6 right awy including comissions. So I have to wait 6 ticks before I can show any profit. My trading style generally means I trade for only 10-20 ticks. aka up to 60% of my trade goes into just moving into profit. Terrible news for me.
2. Options often take on their own properties and deviate from the models and behaviors of the underlying. Since I chart the underlying, it does not make sense for me to trade the option while looking at the underlying security.
3. Too much hassle and calculations.

Also, I need to be able to trade off hours because of my job, etc.

So what do I trade? FUTURES!!! Woo hoo, join the bandwagon!!! But I can see why the futures market is so immensly popular:
1: bid/ask spread on ES, for example, is usually only 1 tick. Inlduing commissions and all, 2 ticks later I am in profit zone. Much more suitable to my trading style.
2: Futures, although do take on properties themselves, are generally easier to manage.

Defined Strategy
Strategy is simple: When I hit a 9 on a TD setup or a 13 on TD, and my composite index is also showing momentum in that direction (MA is above/below the actual value) I trade that direction, with clear targets and stop losses.


max loss per trade:$400 (so any trade with a stop loss exceeding that, I cannot trade).


Long term goals
Well besides the obvious: make a ton of money, I want to ultimately automate my strategy. In order to do so, I am tracking some key statistics that will help me refine my strategy. You will see these stats pop up in my future posts.
I also need to stick to the rules much more strictly this time around. For every trade, I am recording whether I followed the rule or not. Saying "Did not follow rules" almost reminds me of my elementry school teachers and imposes a sense of discipline that I cannot put on myself (growing up in India is tough!).

So, let us enjoy the ride:

First 3 trades:
3/7/2011
Trade details:

Long 2 ES contracts at $1307.25
Stop loss $4.50 (18 tickst) below entry price at 1302.75

Strategy:
If price reaches 1308.25 (4 ticks), move the stop loss to BE + 1 tick.
Target 1: $1311.50 (17 ticks) - Sell 1 contract and set trailing stop of 10 ticks
Target 2: $1322.75 (62 ticks) - set trailing stop of 5 ticks

Outcome:
Rules were followed.
MAE: 2.75.
Exit price for both contracts: 1307.25
Commission: $14
Profit: $(14)

Reflections:

All rules were followed. Looking at this trade the Risk/Reward ratio sucks. I calculate profit targets and stop loss based on fib ratios of the previous move. I should calculate the ticks of the ratios and apply them to the entry price (as I did with stop loss). Otherwise, I move the stop loss to BE after moving a mere 4 ticks.

Had I done the above, I would have waited 14 ticks (as opposed to 4) to move my stop loss to BE and all profit targets would have been 10 ticks higher.


3/8/2011
#1:

Saw a sequential set up along with the oscillator crossing over on both the 15 and 5 minute charts. I was a little late in getting into the trade because... well because I was not paying attention.

anyway here are the details:
Long 2 ES contracts at $1310
Stop loss $2.00 (8 ticks) below entry price at 1308

Strategy:
If price reaches 1312 (4 ticks), move the stop loss to BE + 1 tick.
Target 1: $1314 (12 ticks) - Sell 1 contract and set stop loss to 1312.
Target 2: $1319 (36 ticks) - set trailing stop of 5 ticks
Outcome:
Exit 1 rules were followed. Price moved to target and 1 contract was sold.
Exit1-MFE efficiency: 40%
Exit 1- Risk efficiency: 88%
MAE: 1.
Exit 1 price: 1313.50
Exit 1 Profit: $161

Exit 2 rules were broken slightly. I noticed that the contract reached a resistance level and was having a tough time breaking it. So I decided to set the trailing stop earlier and got stopped out.
Exit2-MFE efficiency: 80%
Exit 2- Risk efficiency: 175%
MAE: 1
Exit 2 price: 1317
Exit 2 Profit: $347

Reflections:
Had I not prematurely activated the trailing stop, I would have probably doubled my profit so should have stuck to plan...
on another note, I should start tracking Bench statistics to see exactly how much I missed out on.


3/8/2011 Trade 2:


A sell setup completed with falling osciallator lines. Additionally setup complete on 15 minute chart as well. I was expecting a big drop. Did not happen but I did make a small profit

Trade Details:
Short 2 ES contracts at $1324.25
Stop loss $2.00 (8 ticks) above entry price at 1326.25

Strategy:
If price reaches 1323.25 (4 ticks), move the stop loss to BE + 1 tick.
Target 1: $1321.25 (12 ticks) - Sell 1 contract and set stop loss to 1323.25.
Target 2: $1316.25 (36 ticks) - set trailing stop of 5 ticks

Outcome:
Exit 1 rules were followed. Price around 10 ticks then started retracing. A setup was completed in opposite direction so an immediate buy order was placed.
Exit1-MFE efficiency: 50%

Exit 1- Risk efficiency: 63%
MAE: 1.
Exit 1 price: 1323
Exit 1 Profit: $49

Reflections:
All rules were followed. Although the trade did not work out as planned, I feel pretty good about it since I followed the rules.

Thursday, March 3, 2011

Strategy definition

Wednesday, October 6, 2010

September Slump

Real Account
September is historically a month when the stock market takes a hit. Unfortunately (for me) this September defied history and S&P500 climbed steadily more than 100 points. Unfortunately, this coincided with the time when I stopped paying close attention to the market and ended up taking some hits. As I look back, I can see that all my signals were there and had I followed my trading system, I would have profitted even though my bearish outlook was incorrect.

Oh well, lessons learned. For now, I have a lot of cash just because I am unsure as to what the market is doing. We broke the 1145 resistance I had been holding on to but my indicators are not giving bullish signals yet. The shorter term charts are bearish while the longer term ones are bullish/consolidating. See the chart below. An interesting point to watch for is the fact that the downward and upwards channels have created a confluence zone right above the current price. I think the market is going to test these trend lines and whichever side the price breaks to is the side to bet on.


Virtual Account
Since I am not a full time trader, keeping up with the signals spit out by my heat map was overwhelming. At one point I was up nearly 10% on the account (of $100,000) in a matter of 2-3 days but because I was unable to liquidate when the signals showed up(due to negligence), I did not capture the profits and now I am down 7%. Clearly, I need to either dedicate all my time to this or develop some sort of automatic trading system.

So, that is my next project. I have already refine the program to spit out buy/sell signals instead of TD studies' counts. The program needs some refinement and then eventually I am going to set it up so it can put through automatic buy/sell orders.

-Wown
stockjockz.blogspot.com

Thursday, September 23, 2010

Market Update

Real Account
SP500 reached a high of 1147, a fibonacci level I had identified previously, and closed 25 points lower today. I missed that boat until this morning. But I do believe we are headed lower. My last two trades have been closed for small losses because the reversal I predicted did not come. The signs are all there, I think it is just a matter of time.

Virtual Account
Using the heat map, I identified a few opportunities last week. I shorted JOYG, BIIB, and VZ last week. VZ and JOYG got stopped out for a loss while BIIB is still an open position.

This week, JOYG remains as a possible sell position. Additionally, GILD is an excellent sell candidate. Also on the sell watchlist are:
AAPL
CHRW
DD
AMZN

No buy prospects this week, again.

-wown
Stockjockz.blogspot.com

Monday, September 13, 2010

Trade Update and Heat Map Update

Trade Update
In my previous post I said I was expecting a reversal on 9/7. On 9/8, SPX fell aroudn $11. But over the next couple of days, SPX rose, broke the 1104 resistance and closed today at 1121.90. Luckily, I closed out most on my position on 9/8 and closed the entire position out for around 15% profit.

As far as what's next, I think this is a fake break out and we are still due for a reversal of some significance. Reason being that we created a double top today just below 1125, another resistance level I have stressed in the past. Additionally, all my indicators are showing bearish signs. I think we might ahve an up day tomorrow before selling off for the rest of the week. However, I am waiting for a confirmation (on either side) before making any bets. I will keep you posted.

Heat Map
After many months of delay, bug fixing, errors, and frustration, the heat map is FINALLY complete in its entirety and ready to use. I have been testing this version for a week on the DOW 30 and NASDAQ 100 and have not seen any errors as yet.

Note: if you are unfamiliar with TD studies, I suggest a google search on TD setup, TD combo, and TD sequential before reading on.

This version features:
1. An accurate TD Setup Buy/Sell counts
2. Accurate TD Sequential counts (With an option to make aggresive counts)
3. Accurate TD Combo counts
4. TD Support and Resistance levels (when 0, it is N/A)
5. Count refresh on market close each day (so, unfortunately, it cannot be used for intraday trading. Perhaps the next version will include this feature).

I plan to test a trading system using this heat map by setting up a virtual account of $100,000. Every day (or as much as I can :) ) at market close, I am going to filter the table for those stocks hitting one of the following criterion:
1. 9 or more on Buy/Sell Setup
2. 12 (only because I am noticing that often price reverses at 12 rather than 13) or 13 count for sequential.
3. 12 (only because I am noticing that often price reverses at 12 rather than 13) or 13 count for combo.

I will analyze any of the stocks hitting TWO of the above criterion (within a 5 bars of each other) and see if the stock is at a Fibonacci convergence level.

If, so, I will, trade ATM options (in the direction that the study predicts) for a position size nearest to $5000, setting a stop loss of $1000 (or above Fibonacci level, whichever is less) and target of the support/resistance as stated by the heat map.

My exit strategy will be to sell 50% of my position when we reach 50% of the way to the target and move stop loss to breakeven for the rest of the position. Otherwise, sell another 30% at target and set a trailstop of 5% (on the option) for the rest of the 20%.

At any given time, I will hold no more than 5 put and 5 call positions and no more than $20,000 invested.

Be on a lookout for a weekly update of what stocks are on my watchlist that week and a summary of last week's performance. I have a strong feeling that the system will work well - if not at least I don't loose anything. Today's update is below:


No immediate trades but the following could be potential Put trade opportunities:
1. QCOM: 7 on Setup and 11 on Combo mixed with a declining oscillator right around an important Fibonacci level makes buying puts on QCOM quite attractive. However, we did recently break downward Fib. channel meaning that this could simply be a small retracement.


2. VZ: Similar situation as QCOM.


3. BIDU: Approaching the top of a channel that BIDU has been adhering to for a while now.


4. BIIB: Hit 13 almost in junction with a setup completion after a lot failed perfection attempts at completing the sequence.


-Wown
stockjockz.blogspot.com

Wednesday, September 8, 2010

My Views on Trading Implied Volatility vs. Price

In my previous post I mentioned that I no longer want to trade IV because:
a) I am not as good at trading IV.
b) When you trade IV, you are essentially trading price so keep things simple and trade price.

Below is a more technical explanation of the above two statements.

Conversation on InformedTrades.com

I post a copy of this blog on InformedTrades. The following conversation took place between myself and another user (Forexer) on InformedTrades:

Forexer:

Here you about volatility. You think volatility follows the normal distribution? Price doesn't. Price is lognormal. They have skews very frequently and that is exactly what makes them tradable. I rather sell volatility than buy them because high IV usually erodes slowly at the least or maybe revert back to the mean. We can use statistics in trading volatility to a great extent. But we know its not all about volatility


Me:

Volatility is supposed to follow a normal distribution from what I understand. Reason being that the means of multiple lognormal distribution should be normally distributed. Since the means of the multiple lognormal distribution is basically what volatility is, we should conclude that volatility is normally distributed (correct me if I am wrong - been a while since I studied option theory).

But like price, I would argue volatility too should be lognormal because although volatility is supposed to measure the increase in price movement, [implied] volatility rises when price falls and vice versa. So IV really isn't measuring the variation in price but rather the market's belief or reaction to negative price movement. So, since price distribution can be skewed and volatility is simply the reaction to price movement, it too should be skewed.

Which brings me to my original point: if you trade IV's, you must take into account the fact that negative price movement will raise IV. So, you should long IV when you expect price to decline and vice versa. But why would you go into such complicated calculations when you could simply trade the price in the first place.

Hope all of that makes sense


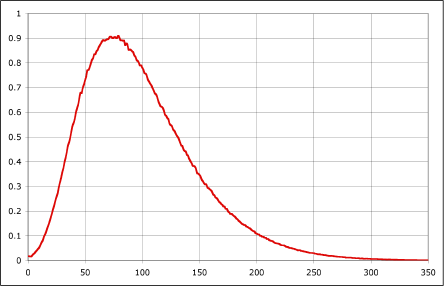
Let me explain that a little bit. A lognormal distribution looks like the graph below:

Source: danvk.org


The reason for this lognormal distribution is quite intuitive. The price can never fall below zero so the lower limit is set at zero. The upper limit is infinity however realistically speaking the price will be centered around the mean (which in this case is around 75).

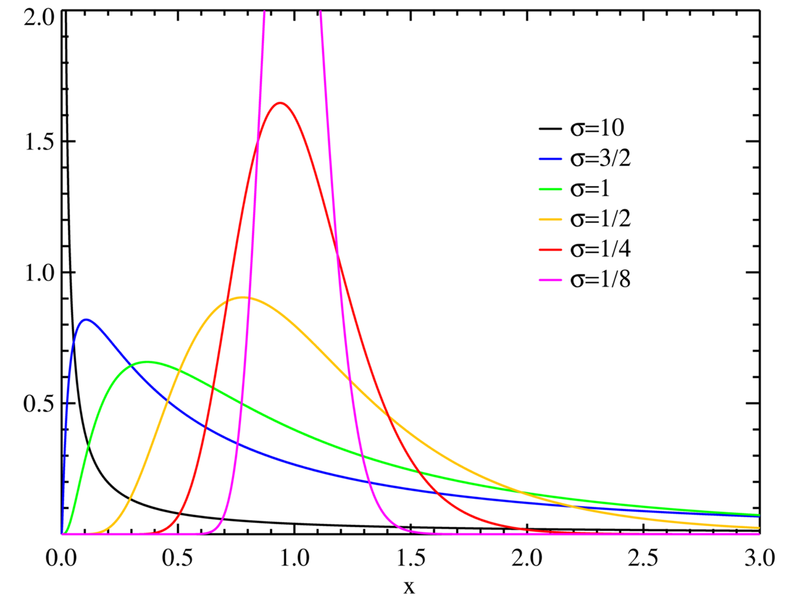
However, different set of price data for the same security can have a different lognormal distributions. The difference in this variation arises from variations in the mean and the standard deviations. For example (only illustrative), in the month of August, SPY could have a mean of 110 with a standard deviation of 10. In August, however, the average was 105 with a standard deviation of 20. These two data sets would yield two different lognormal shapes. This is illustrated in the graph below:


Theoretically, the means (averages) of all these lognormal distributions will have a normal distribution. In other words, if you created a data set of the means of all of the lognormal price distributions of a security and plotted it, the distribution would resemble the below:


Theoretically, this normal distribution is the volatility of the stock. But all of this seems counterintuitive to me. For one, remember that a normal distribution does not have a lower limit. So essentially you are allowing for negative prices - even if the chances are one in a billion. Additionally, and this is simply speaking for experience, IV tends to fall a lot slower than rise and this is clearly not represented in a normal distribution. Thus, there is a BIG disconnect in what IV actually is vs. what it theoretically is.

In my mind, IV is simply another way to say what the option's price is - which itself is simply a derivative of time value and underlying's price. Theoretically IV is supposed to imply how much the market believes the stock will move by expiration, but in truth, I believe it simply says "how afraid are people that stock will fall". The more afraid they are, the higher the IV (yes, even the call IVs - although this is often overlooked simply because the falling price deteriorates the price of calls).

Continuining with the coversation from above:
Forexer
Yea. Hats off to you. I'm not a math guy but i hear you on the IV being lognormal. Does IV increase on large updays?


Short answer: No. If anything IV falls on large updays. Take a look at the chart below of the SPY:

The chart shows SPY price plotted with average implied volatility. Granted this is not a very thorough study of IV vs. Price, but you can clearly see:
a) IV rises a lot quicker than it falls.
b) Price and IV are negatively correlated (When price rises, IV falls and vice versa). Notice the price vs. IV from Feb to May and then again from late June to August.

-Wown
stockjockz.blogspot.com

Tuesday, September 7, 2010

Another Reversal

First week of September saw a nice rally in the markets and thankfully I was able to ride most of that move up. In fact, a friend of mine asked me "A lot of financial journals are claiming that a big sell off is coming. Should I short?" I answered "Yes, but only if SPX breaks the support at 1040". That day SPX went to 1039.88 and rallied. A couple of days later SPX went to 1039.35 and rallied all the way to 1010.

Meanwhile TOS updated its software and in the process all my charts were erased. So for a while there I was trading on gut instinct because TOS support claimed that the charts would be available soon.

On Friday I finally contacted TOS support and asked them the status. Turns out you can reverse an update and that is exactly what I did. When I got my beloved charts back I saw that SPX was trading just below 1105 resistance I had found a while ago. Not only that but the Demark countdown and setup hit 13 and 9 respectively. I quickly liquidated my long calls and now I am sitting on a put vertical. I expect the price to drop to at least 1080. However, I may be inclined to cash in the profits (currently at 4%) if the oscillator breaks the downward trend (see red line).


In other news, I am going to try increasing my position sizes. My performance and price reversal predicitions have been very accurate lately and I believe it is because I have finally found a combination of fibonacci trading techniques and indicators that work. So, feeling more confident, I am going to increase my risk apetite. Also, most of my trades have some sort of an 'insurance' policy now where even if I am wrong, I have a counter trade that at least helps me break very close to even. Of course, I am still keeping my positions and max loss at around only 4% of my account.

Finally, I have been considering what has helped me perform better lately (Compared to 8 months ago when I was down 20% of my account). First, I am not trading news anymore. By the time retail traders get wind of the news and act on it, it is almost always too late. It is also no use trying to predit the news because again, if you are making a prediction, you can bet a lot of others are as well and acting upon it.

Secondly, I have been sticking very strictly to my trade plans - taking emotion completely out of the picture. It is tough watching your trade take a 50% hit and having the patience to let it play out. I think I have finally managed to learn that lesson.

Finally, I realize that I am terrible volatility trader. Many experts out there claim that if you trade options you must trade the implied volatility. Also, they claim that since volatility usually operates within a given range, it is easier to predict. I say all of that is a bunch of crap. You have to know the direction of the move unless you are 100% delta neutral (Which is theoretical anyway) all the time. Maintining neutrality alone costs a fortune in commissions.

Additionally, and maybe this is just me, predicting volatility is just as hard, if not harder, than predicting price direction. Reason being that IV is a derived mathematical and theoretical number to which you cannot assign technical studies. So, I feel people are better off just taking advantage of the leverage properties of options to trade the underlying.

-Wown
stockjockz.blogspot.com

Friday, August 6, 2010

Revisiting Old Friends: Told You So

I woke up and while I was eating breakfast, saw that the S&P500 futures were up around $2.25. I made a note saying "Sell long puts from the diagonal" thinking we broke 1125. I figured I would take a small loss right now and by August expiry I will have made a little profit from the short puts in my put diagonal (see Revisiting Old Friends).

I got to work and checked the futures and to my surprise, the futures are now DOWN $10!

All I say is "Told you so" and scratch my note.

-Wown
stockjockz.blogspot.com

Wednesday, August 4, 2010

Revisiting Old Friends

In my previous posts I have stressed the importance of the SPX price levels at 1104 and 1125.72. Time and again since November 2009 we have come to these price levels and seen resistance. The market closed today at 1127.74 - just above the higher of the two levels mentioned. We tried this level back in June (note also that this area served as intermediate support in May) and failed to breach it. Will be make a run to the upside this time after beating 1125?

Who knows - all I can say is that we will probably make a sizeable move one way or the other and so I am setting up for a trade to capitalize on that.


A couple of interesting points on this chart:
  • Firstly, notice how well the chart has followed the blue fibonacci channel. I drew this channel back on July 19th. The accuracy of the support and resistance points is uncanny - still amazes me. Anyway, the point is that I see the market trying to break the resistance but really not able to do so - giving a bearish indication.
    Do not forget, however, that this is an upward sloping channel thus indicating that we are in a bull trend (on the 15 minute chart at least) and we may simply be in for a correction before a rally (or perhaps the correction already occured and once we break the resistance its a bull-run!).

  • There have been multiple sell signals on the DeMark indicators. Additionally, the top of market failed to reach the top of the channel, indicating that the market may be contracting. Again these are bearish signals.


The same chart on a daily time frame shows an even bearish picture. Firstly, please excuse the light gray channel on the chart - it is the channel as shown in the chart above. I would have liked to simply hide that channel but TOS will not let me hide a single channel.

Getting back on track, you can see that 1125 has held its resistance for three days and now we have approached the top most leg of the downward sloping channel. IF we were to break this channel and break the 1125.75, it would be a very bullish signal. However, seeing as how the EW pattern seems to have played out in a perfect 1-2-3-4-5 and that the oscillator has been trending downwards while the market is rallying, I have serious doubts that we can break this resistance without more buying pressure.

When I started writing this post, I felt I had a neutral outlook on the market. However, I sound very bearish in this post. Originally, I was going to trade a straddle with as high (least negative) a theta as possible. Instead I think I will go with a put diagonal (I believe that is now my most frequent trade). If we break 1125 and the channel top, at least I can sit on short puts until they expire.

The Heat Map/TD studies filter
I have had a couple of questions on the update for the heat map/TD studies filter I have been working on. Unfortunately, I have not had the chance to work on that at all. Suffice to say that one point I had everything working but then realized it was quite buggy. I am still trying (well not really at this moment, but soon will try to) figure out the cause of the bug.

-Wown
stockjockz.blogspot.com

Tuesday, June 29, 2010

Market Commentary 6/29/2010

In my previous posts I mentioned that SPX would reach 1104 and then turn around. I also said that if the move was confirmed on the daily charts, I would take a short position on the SPX.


I did just that - bought a Put diagonal when SPX was trading at around 1094 (see chart - the blue circle). Of course since then we dropped significantly and bounced off the 1040 area that I said would prove to be the support. Not surprisngly, the sequential hit 13 today on the 15 minute chart.

However, the trend is still very much bearish. Look at the fibonacci channels in the chart - it shows the market is still very much within the bounds of the channel and the lines have not broken.

Keeping this in mind, I sold half my diagonal, capturing ~21% profit. I am now sitting on a diagonal with very high theta. If the price consolidates or continues falling, I anticipate making ~40% profit. Meanwhile, I am keeping an eye on the daily oscillator and setup count (Which has reached 7 already). If that turns bullish, I will tighten my stop loss and exit the entire position.

Additionally, take a look at the table below. In ninjatrader, I finally have setup working to perfection. Sequential and Combo studies are nearly there as well, just needs some tweaking.


The colors really help you see when the trend is reaching exhaustion. For example, notice that most stocks are showing up as green while only a couple are red. This means that the bear trend may be ending soon. I can also filter the table so that I only see stocks that hit a 8/9 yesterday.

-Wown
stockjockz.blogspot.com

Tuesday, June 22, 2010

Feels good to be right!

In my previous post:

The new retracements and expansions confirmed the 1104 level. I found a new confluence zone at 1125 area that could prove to be stiff resistance.


The SPX topped at 1131.72 (a mere 6 points off) and fell around 3% in a matter of a day and a half. Not only did we have a fairly dramatic sell off, but we closed today below the 1104 support that I have been stressing.

As far as trading strategy, I have been taking small profits along the way down but the sell off occurred so quickly I did not find a good entry point. Moving forward, I am going to wait on a confirmation of the 1104 breakout to the botton on the daily chart. I think we could rebound a little tomorrow and test the 1104 area before moving downwards again. If this occurs, I will take a large short position with a price target of 1040 and a stop loss at 1125.

-Wown
Stockjockz.blogspot.com

Thursday, June 17, 2010

1104 the support now?

The SPX finally broke and has maintained the 1104 resistance on a closing basis. As I mentioned in my earlier post, I thought that if this event occurred it would herald a resumption of the bull trend.

However, today I suprised myself at how much my perspective changed in just a couple of added days on the same chart:


Firstly, the two days that we registered (keep in mind today is not over yet) above 1104 have both been down days. This indicates that the breakout is fake and we could reverse yet. Secondly, notice that the TD setup has reached 6 meaning that the potential bull rally is over in 3 days. Third, the oscillator has reached overbought territory further indicating an exhaustion of the bull run.

So I decided to pull one of the older tools in my arsenal: Fibonacci levels. I have not used these for a while. My first observation came as no surprise: the new retracements and expansions confirmed the 1104 level. I found a new confluence zone at 1125 area that could prove to be stiff resistance.

Finally, my monthly oscillator is taking a dive from the overbought area indicating that this may be simply a correction in a much larger bear trend.

So here is my hypothesis: we will continue to rally to around 1125 area and then go right back down. I think I will wait for the confirmation of this move to come around before I make any major trades.

In the meantime, I think I may switch brokers to Tradestation. Their platform allows for much better custom studies and more importantly much better screens. Not to mention their commission rates are lower. My only concern is the whopping 7% margin interest rate which would be a pain.

-Wown
stockjockz.blogspot.com

Monday, June 14, 2010

Retested 1104 and failed


Today I thought we might break the 1104.7 resistance for the S&P500. There was a break on the daily downward trend (blue line) that has been holding up for quite a while now. Early afternoon today we also broke the 1104.7 resistance I have been stressing for a while and I ALMOST took a long position on the S&P500 (I have liquidated by short positions I mentioned in my earlier post).

Instead, I shorted the market and took a small profit as the market retraced. However, I am out of that position as well because I think we can still break the resistance. Already the selling pressure is abating and as I am typing my oscillator is turning positive. I think that during this week we can see a confirmed break out above 1104.7 but it could come after a couple days of consolidation around that level.

My GS short calls and SPY short puts are nearing expiry, both OTM. The SPY is a near guarantee while GS still has around 3% chance of going ITM. I am reading The Black Swan at the moment and so I believe the 3% is definitely a risk. I am considering getting out of that position, especially if the SPX breaks 1104.7. I have already made a 95% profit on that trade and now I am just being greedy.

- Wown
stockjockz.blogspot.com

Wednesday, June 2, 2010

Short on the market

This is my first post in nearly a month. As usualy, I have been very busy but have been keeping track of the markets.

I believe for the moment we are in a bear trend and even as today we are up ~1.60%, I think we can expect a few more weeks of sidways or downward movements. I am watching the resistance levels established by the market (S&P 500) at 1218, at 1170, at 1107 during the up swing from Feb to April. Since mid-April, when we started going downwards, the market rebounds, hits or approaches these levels and falls down again.

So, keeping that in mind, I am short on SPY. The only 2 things on my books right now are:
1. Short calls on GS at 170 expiring in July
2. A put 101/108 June/Sep diagonal (got very high premiums for the 101 puts so worst case scenario I get stopped out for the Sept puts and still make profit).

Still working on that spreadsheet, although slowly. The more I read about the study the harder it gets to program the damn thing...

-Wown
stockjockz.blogspot.com

Sunday, May 9, 2010

What a week!

Wow, once in a lifetime kind of a week. Unfortunately I did not fare well through the roller coaster.

I was very busy with work so even though my indicators started showing bearish signs on Friday 4/30 and also Monday, I did not set adequate stop losses and took some pretty big losses on Tuesday. I thankfully managed to get out of a lot of my positions by the time the big "crash" hit. But I still had some long positions and as it happened, I was driving around and internet-less that day.

As things started going bad, my buddy was texting me the dramatically falling prices. One text simply said "its a crash. down 900" and this triggered a panic attack for me. I was sitting in a car FREAKING out thinking "Oh my god! I may have just lost everything!".

Luckily the market came back and I had short positions on GS and QQQQ so my losses that day were not that great. What really took me out was a case of the fat finger on Friday. I was watching the markets and mid day Apple showed bullish indications. So I decided to take a long position by buying ONE call option. Accidentally, however, I bought TEN calls. So, I said "that is fine, I think it is going up".

And Lo and Behold, Apple rises ~$3! Jubilant, I check my position and see that I am DOWN ~$2000. Thinking that there must be widespread falling IV's because of the rise and the delta effect has not kicked in yet, I hold on to my position. My losses just keep going up, however. At -$2100 I realized I had bought TEN PUTS instead of ONE CALL!

As a result, I have now decided to take a break. I need to develop a more solid trading plan and always set firm stops.

I am working on using TD indicators. Below is a screenshot of a spreadsheet I am developing:


The spreadsheet can download 10 years' historic data for the stocks listed on the left. It then calculates TD Setup numbers on daily, weekly, and monthly charts. I plan to add TD Sequential and Combo as well to the table and finally add PLDot numbers.

I can then use this as a screen to find stocks breaking trends on the PLDot and combo completion.

-Wown
stockjockz.blogspot.com

Wednesday, April 21, 2010

Chart Series: BIK


Comments
I bought BIK thinking of it as a long time investment (5 years or so). But I have lost around 10% on this investment so I went out of it. I still think fundamentally the BRIC sector has a lot of potential over the next 5-10 years (although there are concerns about China showing signs of slowing down and letting the yuan float which could hurt chinese stocks).

So I went back and looked at the index technically and realized I bought it at the top of a correction (d'oh, should have checked techincals before buying!). BIK is in a bear trend at the moment daily, moving sideways on the weekly, but on the monthly if we can close above the PLDot, a new bull trend will be established. If the weekly and the daily charts can follow up (which needs to happen anyway for the bull trend on the monthly to occur), I will buy back into BIK.

Also, I am keeping a close watch on the composite oscillator, looking for signs of reversal. I think the oscillator has reached about as low as it will go so should turn around soon. We are reaching a very key support at 24.7 which could very well be the turning point.

Tuesday, April 20, 2010

Chart Series: DIS


Comments
I bought DIS as a long term investment a while ago and the bullish trend has continued for a while. The stock, on the daily chart, is consolidating pre-earnings but is still showing support not far below the current price. My target is around $43 for DIS because of the bullish signals on the weekly and monthly charts.
Not to mention I think the FIFA world cup and acquiring the Marvel franchise helps disney fundamentally quite a bit.

My Trade (Investment)
long 300 shares of DIS.