NHYT.OB is an automotive fuel company stressing green technologies and I am expecting big things from them on the heels of a couple of their recent press releases. Research Report has given Neohydro Technologies Co. a $1.50 price target within the next 18 months and I am actually anticipating an exciting short term run up over the next 2 weeks as well. Currently at .27 cent per share, I feel this bad boy could be seeing the .60's by early next week, don't miss the boat on this one! Good luck!
Wednesday, September 30, 2009
Back Ratio Spreads Explained
The Back Ratio provides excellent risk management and is good to trade when you have a directional bias on the stock but want to protect yourself in case the stock does not behave as you had expected. This makes the Back Ratio a good trade before earnings' announcements or other significant news events.
Basic transaction:
If you are bullish on the stock.
Sell lower strike call
Buy higher strike call
Where you buy more calls than you sell. The usual ratios (thus the name back ratio spread) are 2:1, 3:2, 5:3. For instance buy 2 calls and sell 1.
Both for same expiration, preferably 2-3 months out.
This trade is shown below in the risk profile graph.
OR
If you are bearish on the stock.
Sell higher strike put
Buy lower strike put
Where you buy more puts than you sell. The usual ratios (thus the name back ratio spread) are 2:1, 3:2, 5:3. For instance buy 2 puts and sell 1.
Both for same expiration, preferably 2-3 months out.
The risk profile will the similar but opposite to the risk profile below.
Risk Profile:

Current price for BAC is 16.90.
Sell 1x 17.5 calls for .95/contract
Buy 2x 19 calls for .47/contract
Total net CREDIT .01/2:1 ratio.
Strategy:
The first thing to realize for this trade is that we have a net credit. This means you GET .01/spread. This does not necessarily happen every time. It is just as easy to find net debit spreads or net credit spreads where the credit is pretty significant- it really all just depends on the implied volatility of the options. Keep in mind that if you have a huge net credit spread, it means that the demand of your short option is much bigger than your long option. This could mean that you may have missed something in your analysis and need to figure out why the demand of the short option is so high.
Secondly, a back ratio is something you never keep till expiry (unless you have a net credit and the stock goes way south of where you had expected it to go). So, in my explanation below, I will assume that we will trade away this back ratio after 3 weeks.
You bias on a call back ratio is bullish and a put back ratio is bearish. The basic reasoning for trading a back ratio is that it reduces your cash outlay, and as seen above, can in fact create a credit trade. Back ratio also significantly reduces your risk if your hypothesis is wrong and the stock moves the other way. All these are explained below in more detail.
But first, I will illustrate what would happen if you simply bought a call contract. If you bought a Nov call contract for strike 19, your cash outlay would be $.47/contract. Your max loss, after 3 weeks, of $.47/contract is highly unlikely. A more likely scenario is a support level your identify. Assume this support level is $15, at which point your loss is .33/contract, or about 70%.
Your max profit is infinite if BAC rises forever. Your infinite profit scenario is highly unlikely. What is more likely is that you will identify some resistance/target level that you expect the BAC to reach. Let's say this target is $20. At $20, your profit (in 3 weeks) is 1.26/contract. That is a ROI of 268% (Woah!) when the stock moved 18%. That is pretty awesome.
How does the Back Ratio compare to simply a long option. First of all, you have a net credit so you cannot use a ROI to figure out your return. Instead, I use return on margin requirement, which is $1.46/spread. Max loss, after 3 weeks, in this case is around .09/spread, which you get at $16.70. At ALL other price levels, your loss is less than .09/spread, or about 6%.
Your max profit is infinite, but highly unlikely. Assuming the resistance level of $20, your profit at $20 is .66/spread. That is a return on margin req. of ~45%.
Reduced Cash Investment
As is clear, the cash investment for a Back Ratio is significantly lower than for a simple long option. On the other hand, the margin requirement is much higher. However, if you have a broker that will let you reduce margin requirements (because you will never reach that max loss level), you might be able to leverage that and use those funds for other investments.
Reduced Risk
The max loss for a long option, based on the scenarios described above, is around 33%. Compare that to a mere 6% max loss scenario for the Back Ratio. Also, remember that the 6% loss is only possible at a single price level, which is unlikely. What is more likely is that with the Back Ratio your max loss exposure is much lower than 6%.
Potential Return on max loss: 1.26/.33= 318%
Potential Return on max loss: .66/.09 = 733%
Volatility Play
Another important aspect of the Back Ratio is the importance of implied volatility in this strategy. The biggest take-away is that if the implied volatility of the options rises, your position, payoffs, and risk exposure improve significantly. If it falls, you are much worse off.
Entire books have been written on this subject so I will not go into more detail on this subject in this post.
In conclusion, the Back Ratio is an excellent choice when trading an underlying which could move either way. You clearly have a directional bias and anticipate the stock to move one way, but you are not exposed if the stock does not behave as you had anticipated.
Tuesday, September 29, 2009
Short Play on Neutral Tandem

I believe this may be my first short idea on this blog and I believe it is a good one. We are on top of a possible A subwave of a major wave 4. The stoch and moving averages have both made a bearish reversal very recently. The time studies also show that the correction should be over between 10-6 to 10-7. We might not even see a long ABC correction in which case the correction could be over as soon as 9-30 to 10-1.
Also look at the extremely light volume on the modest up move from the lo of 21.19 - further confirming the hypothesis that this move up is simply a correction. Finally, The major trend is bearish on the weekly chart. The weekly chart also shows a target zone of about $19-20.

As far as the trade set up, I did not find anything good on the options side - the volume is too light. I would just short the stock if it breaks below 22.68 with a stop loss at 23.20.
Monday, September 28, 2009
Market Breadth Studies for TOS

Here are two custom studies I've coded for TOS platform which deal specifically with NYSE Up/Down Volume.
The first one is NYSEBreadth and gives you a histogram which totals the Up Volume + Down Volume to give you total volume for the day. The blue line plotted over the histogram is the ratio to show how strong the volume was. If there is more up volume then down volume then the ratio will be (Up Volume/Down Volume). If there is more down volume then up volume then the ratio will be (Down Volume/Up Volume). Another words, don't be using this as some type of oscillator or divergence indicator. This inidicator works on multiple timeframe, and I prefer looking at this volume rather than the SPY volume, because you can have days that are up in price but really take a behind the scenes look to see if there was any distribution going on.
NYSEBreadth:
declare lower;
def tVolume = close("$UVOL+$DVOL")/1000000;
def uVolume = close("$UVOL");
def dVolume = close("$DVOL");
plot Breadth = tvolume;
Breadth.SetPaintingStrategy(PaintingStrategy.HISTOGRAM);
Breadth.DefineColor("Positive", Color.UPTICK);
Breadth.DefineColor("Negative", Color.DOWNTICK);
Breadth.AssignValueColor(if uVolume > dVolume then Breadth.color("Positive") else Breadth.color("Negative"));
plot volume;
volume = if(uVolume > dVolume, uVolume / dVolume, dVolume / uVolume);
Volume.SetStyle(curve.FIRM);
Volume.SetLineWeight(2);
Volume.SetDefaultColor(GetColor(3));
The second study that I developed is the ratio of Up Volume to Total Volume but I've noticed it plots much neater if you smooth it out with a moving average. The default is 5. This is used to notice divergences and potential changes in trend before they happen.
NYSEBreadthRatio:
declare lower;
input length = 5;
def uVolume = close("$UVOL");
def dVolume = close("$DVOL");
def VolumeRatio = (uVolume/(uVolume+dVolume));
plot Avg = expaverage(Volumeratio, length);
Avg.SetStyle(curve.FIRM);
Avg.SetLineWeight(2);
Avg.SetDefaultColor(GetColor(7));
A note about getting filled quicker on TOS
I have noticed that when trading options, when you put in a limit order at the current mark price, it can take a while for TOS to fill the order. But, for some reason, if you put the limit order in for 1-2 cents above the mark, it fills almost immediately. It might be worth it to you to do that because sometimes TOS can take a couple of hours to fill an order.
For example, I was trying to trade a spread at .93 limit order. TOS showed mark price as .93. I waited about 20 minutes before changing the order to limit .94 and was filled almost immediately. This is not the first time either - I have noticed this before as well.
On another note, I updated the diagonal spread tutorial with more details.
Sunday, September 27, 2009
Futures Update & TOS Platform
Futures are currently slightly down, testing support. Here is a screenshot highlighting the support/resistance levels to watch on the /ES. Please note that the /ES is currently trading a few points lower then the S&P so these levels are a bit higher on the SPX.

Also I just did a fresh reinstall on my laptop since it was running a bit sluggish. Actually took me quite a bit of time to make my blog post earlier because it kept freezing. After installing the TOS platform again I decided to test out the layout conversions they were working on. They did a really nice job with the grey/metal layout. I much prefer it to the default black.
Weekly Update for Sept 27
It seems I have the most time on Sundays to do a post on the blog. So expect a weekly update, and if I have time I will come up posts of interesting items I find during the week. I have another post scheduled highlighting good individual stock opportunities, however I don't see myself posting that today because I still need to research them further.
Market Summary
To start off we had a very interesting week. The market played out exactly how I thought it would. For a bearish topping candle on the weekly timeframe we needed to expect new highs during the beginning/middle of the week and a strong close near the lows. We did exactly that, so the highs on Tuesday and Wednesday were no surprise to me.
There are several sources now saying that this rally from 666 has topped. According to Elliott Wave if we break below 1039.47, it is almost a guarantee the safest strategy will be to sell into strength because we are going much lower. However the bullish alternative says we can still make one last push to around 1097-1122 [unless we break 1039.47]. Therefore I expect some confusion early in the week with a clarification on Tuesday/Wednesday which way the market has decided to go. I'd say a break above 1058-1060 may lead towards the bullish alternative and any break below 1039.47 is very bearish.
1938 vs 2009
Instead of updating my comparison chart I figured I would show this chart which compares 1938 vs 2009 in much more detail with daily candlesticks. [Interestingly, Yahoo is actually good for something because they are the only source that I can find that has candlesticks for 1938, all other sources just show dots on the data feed.] I've mapped out the rally which ended the 1938 rally and it definitely has a very good correlation to our current wave pattern. The letters on the chart are only used as reference points.

My 1066 Target & Distribution
Like I had stated in my earlier blog post, 1066 looked like an important level to me and I assumed the market needed to reach this before any major turn lower. Although it eventually pushed higher to top at 1080, the market seems to be obeying this 1066 level on the weekly time frame. This gives an even stronger signal to me then the daily timeframe.
Also in my chart is an updated version of my UVOL/DVOL indicator. As you can notice by the color of the last 3 bars, the last 3 weeks have seen sell volume greater than buy volume [also at an increasing rate] even though prices have headed higher. This is of course a bearish divergence. The last time we had 3 weeks of distribution was back in July however if you notice the the volume is much heavier this time around. I think the last major selloff was more confusion and people shorting rather then distribution and selling.
The TRENDLINE
As you know we have been building up a bearish ascending wedge during this entire rally. Basically we have been consolidating up for a new move lower. If I were to believe in this rally I would have rather seen some nice pullbacks along the way. Also I've seen reports say we've done this before (go up with no consolidation) and I looked back to the 1970s rallies where this has happened...and what followed was just another breakdown to new lows. Anyway there has been a trendline holding up this entire rally. Here is just one possible way you can draw it which connects all the lows. If this is correct we better see some quick upside or it may be a signal we are breaking down.

The Dollar and Commodities
Since I went over these last week I might as well give an update since they are very important and will give confirmation of what will happen on the equity side.
The Dollar
The dollar finally is gaining some strength. There may be one last push downwards, but I tend to doubt it. If the market has topped, that means the dollar has bottomed. You will also see the effect of this "bottom" on commodities. If the commodities have built such bearish patterns I cannot see them regaining strength. It is for these reasons I tend to believe the dollar has bottomed.

Gold
Gold is back below 1000. I don't believe in the rally whatsoever. If the dollar is going to bottom which I believe it will, then gold is going to go right back down. No breakout here..... yet.

Silver
Silver continues to look bearish. Would have been a great short last week when I highlighted it breaking down. Also something interesting to note is that silver has lagged gold the past couple years. If gold is to make all time new highs why isn't silver?

Crude
Crude chart looks the worst of all the commodities. Head and shoulders breakdown. Just think if the dollar is going to rally here where does that leave Crude? $50, $30, $20, $10?

Natural Gas
I missed it. I had made a post about a month ago highlighting the trendline in natural gas. I guess I never noticed it because of the lackluster correlation between UNG and natural gas. Natural gas has jumped well over 100% the past couple weeks, but UNG hasn't moved. Oh well.

Market Summary
To start off we had a very interesting week. The market played out exactly how I thought it would. For a bearish topping candle on the weekly timeframe we needed to expect new highs during the beginning/middle of the week and a strong close near the lows. We did exactly that, so the highs on Tuesday and Wednesday were no surprise to me.
There are several sources now saying that this rally from 666 has topped. According to Elliott Wave if we break below 1039.47, it is almost a guarantee the safest strategy will be to sell into strength because we are going much lower. However the bullish alternative says we can still make one last push to around 1097-1122 [unless we break 1039.47]. Therefore I expect some confusion early in the week with a clarification on Tuesday/Wednesday which way the market has decided to go. I'd say a break above 1058-1060 may lead towards the bullish alternative and any break below 1039.47 is very bearish.
1938 vs 2009
Instead of updating my comparison chart I figured I would show this chart which compares 1938 vs 2009 in much more detail with daily candlesticks. [Interestingly, Yahoo is actually good for something because they are the only source that I can find that has candlesticks for 1938, all other sources just show dots on the data feed.] I've mapped out the rally which ended the 1938 rally and it definitely has a very good correlation to our current wave pattern. The letters on the chart are only used as reference points.

My 1066 Target & Distribution
Like I had stated in my earlier blog post, 1066 looked like an important level to me and I assumed the market needed to reach this before any major turn lower. Although it eventually pushed higher to top at 1080, the market seems to be obeying this 1066 level on the weekly time frame. This gives an even stronger signal to me then the daily timeframe.
Also in my chart is an updated version of my UVOL/DVOL indicator. As you can notice by the color of the last 3 bars, the last 3 weeks have seen sell volume greater than buy volume [also at an increasing rate] even though prices have headed higher. This is of course a bearish divergence. The last time we had 3 weeks of distribution was back in July however if you notice the the volume is much heavier this time around. I think the last major selloff was more confusion and people shorting rather then distribution and selling.

The TRENDLINE
As you know we have been building up a bearish ascending wedge during this entire rally. Basically we have been consolidating up for a new move lower. If I were to believe in this rally I would have rather seen some nice pullbacks along the way. Also I've seen reports say we've done this before (go up with no consolidation) and I looked back to the 1970s rallies where this has happened...and what followed was just another breakdown to new lows. Anyway there has been a trendline holding up this entire rally. Here is just one possible way you can draw it which connects all the lows. If this is correct we better see some quick upside or it may be a signal we are breaking down.

The Dollar and Commodities
Since I went over these last week I might as well give an update since they are very important and will give confirmation of what will happen on the equity side.
The Dollar
The dollar finally is gaining some strength. There may be one last push downwards, but I tend to doubt it. If the market has topped, that means the dollar has bottomed. You will also see the effect of this "bottom" on commodities. If the commodities have built such bearish patterns I cannot see them regaining strength. It is for these reasons I tend to believe the dollar has bottomed.

Gold
Gold is back below 1000. I don't believe in the rally whatsoever. If the dollar is going to bottom which I believe it will, then gold is going to go right back down. No breakout here..... yet.

Silver
Silver continues to look bearish. Would have been a great short last week when I highlighted it breaking down. Also something interesting to note is that silver has lagged gold the past couple years. If gold is to make all time new highs why isn't silver?

Crude
Crude chart looks the worst of all the commodities. Head and shoulders breakdown. Just think if the dollar is going to rally here where does that leave Crude? $50, $30, $20, $10?

Natural Gas
I missed it. I had made a post about a month ago highlighting the trendline in natural gas. I guess I never noticed it because of the lackluster correlation between UNG and natural gas. Natural gas has jumped well over 100% the past couple weeks, but UNG hasn't moved. Oh well.

Thursday, September 24, 2009
Accenture Triple Calendar

There are two key factors for Accenture and this trade:
- Earnings on 10/2 will probably move the stock significantly. If you look at the previous two earnings reports, the stock has jumped up or down around 10%. In anticipation of this, implied volatility for the stock is on the move. There has been a lot of call activity recently, signaling that speculators are anticipating the earnings to be good.
- On the charts, the $33 (orange oval) area is showing a lot of support. We also have a teacup shape in the green rectangle and that has set up a lot of resistance around the $37 level. I anticipate the stock to move between $40 (the year long high) and $33, no matter what the earnings report is.
The Trade:
Although the trade hasn't been executed, I anticipate it will get filled tomorrow morning fairly close to the prices below. The details of what I will buy/sell are listed below in the risk profile picture.

As you can see, if by Oct 16th, the price is anywhere between $29-42, I am in the money and will walk away with a profit. My max profit is $261 on an intial outlay of $285 (which is alos my max loss).
Also, based on the historical standard deviations, my odds of profit are somewhere in the vicinity of 89%.
A trade that has potential of 92% profit in a mere 2 weeks and an 89% probability of profit - I will take that everyday. I will update at what prices did I get filled at and what my final risk profile looks like.
Watch your greeks
I learned an important lesson today: Always watch your greeks.
What are greeks?
An options' price is derived from various greek letters that stand for various different things:
Many strategies out there focus on keeping delta near 0, or theta always positive, or vega high/low in times of rising/falling volatility. I have been focusing mainly on theta and volatility, but I learned today that you should be mindful of all the greeks.
As the SPY fell today, many of my holdings fell along with the SPY. Although my theta and my vega are still positive and the increase in the VIX (overall implied volatility) helped my position, I failed to look at my deltas.
Unfortunately, I had deltas as high as 300 (for every one dollar move up in the underlying, my position would go up $300). Unfortunately, the inverse works as well, and for every dollar move down, I lose $300. And that is what happened. I could have easily hedged my self by purchasing securities with negative deltas or liquidating some securities with very high deltas.
I have taken steps to reduce my deltas and in the future i vow to be more mindful of such things.
What are greeks?
An options' price is derived from various greek letters that stand for various different things:
- Delta: option price's sensitivity to movement in the underlying stock's price. If delta is positive, the option price goes up as stock price goes up.
- Gamma: Options price's sensitivity to movement in the delta (or how fast the delta moves with the stock price). If gamma is positive, delta increases as price goes up, and vice versa.
- Theta: Effect of time on the option. If theta is positive, time is in your favor and vice versa.
- Vega: The effect of implied volatility. The higher the vega, the more you want volatility to be. The higher the volatility, the higher the option price.
- Rho: Effect of the risk free rate
Many strategies out there focus on keeping delta near 0, or theta always positive, or vega high/low in times of rising/falling volatility. I have been focusing mainly on theta and volatility, but I learned today that you should be mindful of all the greeks.
As the SPY fell today, many of my holdings fell along with the SPY. Although my theta and my vega are still positive and the increase in the VIX (overall implied volatility) helped my position, I failed to look at my deltas.
Unfortunately, I had deltas as high as 300 (for every one dollar move up in the underlying, my position would go up $300). Unfortunately, the inverse works as well, and for every dollar move down, I lose $300. And that is what happened. I could have easily hedged my self by purchasing securities with negative deltas or liquidating some securities with very high deltas.
I have taken steps to reduce my deltas and in the future i vow to be more mindful of such things.
Tuesday, September 22, 2009
Resistance Zone - Fibonnaci Confluence
Here are all the relevant extensions and retracements that I can think of. Notice the Fibonnaci confluence around 1097 and 1121. Those are my new targets if we get above 1071 - which has two resistance levels. I don't see this [1071] being the top though since I've stated we have room to run. Also I apologize, but there appears to be something wrong in stockcharts and Prophet. We didn't fill the gap in the SPY yet. Not sure what is up with that.


Diagonal Spreads Explained
A Diagonal spread is an excellent choice when you have a strong directional bias and have identified a strong resistance/support level. It is also an excellent strategy for creating monthly dividend-like income. This strategy is very similar but much better than a covered call. So, if you like covered calls, you should try this instead.
Basic transaction:
If you are bullish on the stock.
Buy lower strike In the money (ITM) call with long expiration
Sell higher strike out of money (OTM) call with short expiration
This trade is shown below in the risk profile graph.
OR
If you are bearish on the stock.
Buy higher strike ITM put with long expiration
Sell lower strke OTM put with long expiration
The risk profile will the similar but opposite to the risk profile below.
Risk Profile:

Dec Call costs 2.9/contract
Oct Call costs .3/contract
Strategy:
You bias on a call diagonal is bullish and a put diagonal is bearish. The basic reasoning for trading a diagonal is that it reduces your cash outlay, thus increasing your ROI. Also, you can use a diagonal campaign to give yourself dividends on a month-to-month basis. Finally, Diagonals reduce your risk in case your hypothesis is wrong. All these are explained below in more detail.
But first, I will illustrate what would happen if you simply bought a call contract. If you bought a Dec call contract for strike 41, your cash outlay would be $2.9/contract. If in case the stock goes south of 41, your max loss is thus $2.9. Your max profit is infinite if the QQQQ's rise forever. Your infinite profit scenario is highly unlikely. What is more likely is that you will identify some resistance/target level that you expect the QQQQ to reach. Let's say this target is $44. At $44, your profit is .92/contract. That is a ROI of 31% when the stock moved a mere 4%. That is a pretty sweet deal. But, with a diagonal, you can do better.
Increasing ROI:
Again, assuming the Dec call costs 2.9/contract, let us also assume that the Oct call strike 44 costs .30/contract (these are actual prices I got while making this post). So you buy the Dec contract and sell the Oct contract, reducing your cash outlay by 10% right away. Thus, any profit you make will have a higher ROI. Additionally, for any stock price below the short short contract, you will have a higher profit than simply with a long call.
For instance, let us say that the stock moved up to $44. Your profit is 1.07/contract, increasing your ROI to 41%.
Dividend Play:
Assume you carried out the trade explained above and by Oct expiry the stock is between $41 and $44 and your bullish outlook still holds. Well, you can go ahead and sell Nov contracts (strike will depend on your outlook for the QQQQs at that point) and rake in another 10% or so. If you had bought Feb contracts instead of Dec, you could do this every month and make around 40% just from selling the OTM contracts.
Reducing Risk:
Going back to the original Oct/Dec diagonal, because your initial cash outlay is lower, in case the QQQQ's fall dramatically, your max loss is much lower compared to if you had simply bought a long contract. This is best illustrated by the fact that the QQQQ's have to hit $31 to achieve a max loss scenario of $2.6/contract for the diagonal trade. On the other hand, anything below $41 gets you max loss of 2.9/contract for the long call. Thus, not only is your max loss lower but also harder to get to.
Of course, you would sell this position off before reaching max loss, but the above point holds true for all QQQQ's prices.
The one drawback of the diagonal spread is that if the stock moves above $44, your profit is capped and in fact you start losing some money after $44. For example, if the stock moves to $54, you will make only $.42/contract. If the strikes for the trade are close enough (for example 41-42 strike diagonal), you could even loose money as the stock keeps going higher. So be mindful of this when trading diagonals.
Monday, September 21, 2009
Celgene: Long Call Diagonal

Looking at the weekly chart, I believe an ABC correction has ended and we are starting a new bull trend. I am basing this hypothesis on the fact that three very key fibonacci retracements and extensions on the weekly chart point 50.70-51.70 price level, indicating that a major correct to the trend should be in that area. 2 weeks ago we saw the stock hit that price and has bounced since then.
Fibonacci time retracements also indicate the correction is over. Finally, the Stoch made a bullish reversal right around the bottom of wave C. Thus, the weekly chart looks very bullish, indicating this is a strong buy. One key level to watch is the 55.80 price level since this has proved to be a major resistance/support level on the 3 year weekly chart (not shown). If we can break above the 55.80 resistance and maintain that as support, the bull trend will be confirmed. The hourly chart (below) however shows that 55.80 resistance is still holding strong.
Daily chart also showing strong bullish trends. The price gap is important because it has created a void which, if the price falls, could be filled in a relatively short time span. Additionally, there has been a bearish reversal on the Stoch which is of some concern.

The two key things to note on the hourly chart are:
1. How cleanly we bounced off the 55.80 level today. The price is going up, up, up and then all of a sudden hits the resistance and cannot hold on at all.
2. The significant advance today because of a couple of upgrades. I feel the stock may be overbought right now and could see some fall back.

Finally, found this chart on Shaeffer's Investment Research which shows how the P/C ratio fell significantly on 9/17. This is of course very bullish. The chart shows the stock price's inverse sensitivity to the P/C ratio.
In summary, I am bullish on Celgene contingent on the price breaking the 55.80 resistance and confirming the breakout. After doing some volatility analysis, Celgene is a good candidate for a Long diagonal.
Buy Jan10 55 Call
Sell Oct09 60 Call
I will post the details of the trade if I decide to go long.
Edit: I just noticed that the P/C ratio graph is different from the one I saw. It shows how the P/C shot up the next day again as the price shot up. Subsequently, the price has dropped. Look for a follow up on how I managed this trade.
Sunday, September 20, 2009
Shorting Penny Stocks
This is something that I found on the hotstockmarket forums, posted by mjoke -- A very good write up on shorting penny stocks and how they work and what not.
I AM Posting this in a effrot to clarify and set people straight.
Some are going around saying certain stocks (pennies) are being shorted.
This is not applicable let alone a good idea.. AT ALL. 9 time out of 10 its a pump and dump and they want you to hold the bag. Yes a few are shorted but as you can see by the MARGIN requirements it inst not a valid nor wise choice.. more so due to the uncertainty of pennies in general and you can lose everything.
You want to short,??
GO TO the big boards where TA and other indicators actually give you security and you can see what is REALLY going on. (within reason)
Regarding PENNIES and SHORTING :::
Many OTC companies are either brand new unprofitable companies or larger bankrupt companies that have fallen from centralized exchanges. As a result, there is a great opportunity for traders to short-sell these stocks – or bet on them declining in price – and make a hefty profit. In fact, some notable traders like Timothy Sykes have made a fortune making such bets. However, there are many large risks to making these short trades must consider.
Getting started shorting penny stock is very simple – just ask your broker if they support this type of activity. Often times, discount brokers will allow clients to short-sell certain popular penny stocks, while only specialized trading firms will allow shorting of almost all penny stocks. However, these specialized firms often have higher commissions and/or a minimum number of trades per month in order to quality. Finally, investors should also make sure they have access to real-time level II screens.
Trading Strategies
Short sellers are simply looking for stocks that are overvalued and betting on their decline. Since the losses are unlimited and profits are limited, it is very important for short sellers to carefully research their prospects and be sure that things are bad. Moreover, it is important to be wary of penny stock promoters that may be trading against short positions and bidding up the prices of the stocks. However, there are many ways to profitably short penny stocks.
Here are a few tips to get started: If you want and have the capital..
•Only short penny stocks that are $0.50 or higher (due to margin requirements and the likelihood of manipulation).
•Carefully watch past price ranges to determine your expected margin requirements.
•Watch for stocks that go up on fluff news or press and wait for the day when it tops out.
•Watch level II quote screens to identify where market makers are placing the floors.
Risks of Shorting Penny Stocks
Margin Requirements
Brokers require investors to put up collateral to guarantee against potential losses in the form of margin requirements. Often times, brokers will require OTC investors to have $2.50 of margin per share to short a stock under $2.50, which can make shorting penny stocks very costly. For example, if an investor shorted 2,000 shares of a stock at $0.50, you have to have $5,000 in your account. All along, the maximum profit for this position would only be $1,000, if the stock went to zero.
Execution Risk
Penny stock short sellers must also worry about execution risk with their trades. Short selling involves borrowing shares from someone else and selling their shares, so even if an investor finds a great short selling candidate, they may be out of luck if the broker has no shares to lend. Similarly, the pricing for these short trades may not be favorable due to the often-large disparity between the bid and ask price. As a result, investors must watch these prices carefully before initiating a short position.
Market Manipulation
Market manipulation has always been a problem in the world of penny stocks, but this risk is especially large when shorting penny stocks, since the losses when short selling are unlimited. The best targets for short-selling are often those subject to manipulation or promotion by unscrupulous web sites of funds. However, these manipulators have a distinct advantage over the short seller – they have capital, price and liquidity on their side – which means investors must be very careful.
Shorting Big Baords, Blue Chips i condone if you have the capital.
Shorting Pennies, Give someone your money instead...
I AM Posting this in a effrot to clarify and set people straight.
Some are going around saying certain stocks (pennies) are being shorted.
This is not applicable let alone a good idea.. AT ALL. 9 time out of 10 its a pump and dump and they want you to hold the bag. Yes a few are shorted but as you can see by the MARGIN requirements it inst not a valid nor wise choice.. more so due to the uncertainty of pennies in general and you can lose everything.
You want to short,??
GO TO the big boards where TA and other indicators actually give you security and you can see what is REALLY going on. (within reason)
Regarding PENNIES and SHORTING :::
Many OTC companies are either brand new unprofitable companies or larger bankrupt companies that have fallen from centralized exchanges. As a result, there is a great opportunity for traders to short-sell these stocks – or bet on them declining in price – and make a hefty profit. In fact, some notable traders like Timothy Sykes have made a fortune making such bets. However, there are many large risks to making these short trades must consider.
Getting started shorting penny stock is very simple – just ask your broker if they support this type of activity. Often times, discount brokers will allow clients to short-sell certain popular penny stocks, while only specialized trading firms will allow shorting of almost all penny stocks. However, these specialized firms often have higher commissions and/or a minimum number of trades per month in order to quality. Finally, investors should also make sure they have access to real-time level II screens.
Trading Strategies
Short sellers are simply looking for stocks that are overvalued and betting on their decline. Since the losses are unlimited and profits are limited, it is very important for short sellers to carefully research their prospects and be sure that things are bad. Moreover, it is important to be wary of penny stock promoters that may be trading against short positions and bidding up the prices of the stocks. However, there are many ways to profitably short penny stocks.
Here are a few tips to get started: If you want and have the capital..
•Only short penny stocks that are $0.50 or higher (due to margin requirements and the likelihood of manipulation).
•Carefully watch past price ranges to determine your expected margin requirements.
•Watch for stocks that go up on fluff news or press and wait for the day when it tops out.
•Watch level II quote screens to identify where market makers are placing the floors.
Risks of Shorting Penny Stocks
Margin Requirements
Brokers require investors to put up collateral to guarantee against potential losses in the form of margin requirements. Often times, brokers will require OTC investors to have $2.50 of margin per share to short a stock under $2.50, which can make shorting penny stocks very costly. For example, if an investor shorted 2,000 shares of a stock at $0.50, you have to have $5,000 in your account. All along, the maximum profit for this position would only be $1,000, if the stock went to zero.
Execution Risk
Penny stock short sellers must also worry about execution risk with their trades. Short selling involves borrowing shares from someone else and selling their shares, so even if an investor finds a great short selling candidate, they may be out of luck if the broker has no shares to lend. Similarly, the pricing for these short trades may not be favorable due to the often-large disparity between the bid and ask price. As a result, investors must watch these prices carefully before initiating a short position.
Market Manipulation
Market manipulation has always been a problem in the world of penny stocks, but this risk is especially large when shorting penny stocks, since the losses when short selling are unlimited. The best targets for short-selling are often those subject to manipulation or promotion by unscrupulous web sites of funds. However, these manipulators have a distinct advantage over the short seller – they have capital, price and liquidity on their side – which means investors must be very careful.
Shorting Big Baords, Blue Chips i condone if you have the capital.
Shorting Pennies,
Give someone your money instead...
To Bull or not to Bull
This market obviously has a lot of people frustrated, myself included. It's getting to the point where we are all trained to buy every single dip. It seems no one is paying attention to longer time frame charts, an intraday pullback of .5% is all that is needed to rally the market forward 3-4%. Will it ever end? The rallies of 2003 sure didn't, and it sure feels like we are back on course to go to new highs. If P3 really exists this rally might be the only way that we could possibly get to 400. Just imagine, if everyone starts to feel confident in investing again, and then the first sign of any type of major fall will start triggering some heavy selling pressure once again. People are trained now to not hold and take on heavy losses and that is what will make the selling that much faster.
Last week I stated a target of 1066 was to occur so I expected a rally, however this week I'm saying that there is a possibility we see a top. That doesn't mean that it will happen because we can just travel to the next inflection point. But let me show you some charts that explain how the "planets have aligned".
Here is your "currency" commodities, copper, silver, and gold. Copper looks the weakest and appears to have setup a double top on the weekly right at the 62% retracement:

Silver appears to have put in a shooting star and reversal signal due to fridays action. I do not believe the buy the dip scenerio in silver as much as I do in equities so I do believe silver will undergo a correction.


This leads us to the major index's. Something very interesting has been brought to my attention. If you chart the SPX index itself, the 50% retracement lies at 1121. However the 50% retracement for the SPY is right actually right here around 108. There is also the major Lehman gap that has been filled. Also keep in mind we are still hovering around the 1066 level in the S&P I posted about last week.

The DIA looks similar to the SPY, however there is still a bit of room to fill the gap. Perhaps leading to upside early in the week and a close below current levels by this Friday:

The QQQQ's continue to look like the strongest of the group and may still have some upside potential. However they too are approaching heavy resistance levels. Again this suggests a bit more upside, but to remain bearish I would like to see a close on Friday below the open tomorrow.

I am also in the camp that believes we need to see some type of capitulation event occur. A "blow-off top" scenerio where the sellers capitulate. Look at the SPX, it recently broke the upper trendline of the falling wedge, and including all other recent trendline resistance, is this a true breakout or is this a sign of a fakeout setup?


Depending on which low you consider in the QQQQ's it doesn't matter because you get a Fibonnaci confluence at around this timeframe. Also take notice how the July low was called by these extensions, perhaps something to give more confidence in this indicator:


Last week I stated a target of 1066 was to occur so I expected a rally, however this week I'm saying that there is a possibility we see a top. That doesn't mean that it will happen because we can just travel to the next inflection point. But let me show you some charts that explain how the "planets have aligned".
Here is your "currency" commodities, copper, silver, and gold. Copper looks the weakest and appears to have setup a double top on the weekly right at the 62% retracement:

Silver appears to have put in a shooting star and reversal signal due to fridays action. I do not believe the buy the dip scenerio in silver as much as I do in equities so I do believe silver will undergo a correction.

If silver and copper fall, so will gold. Also gold is in a heavy resistance area. 1000 might have been a huge hurdle but it still is not at all time highs:

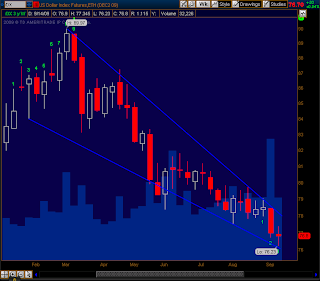
If these commodities will go down, it will because the dollar is going to bounce. Sure enough the dollar hit falling wedge support and appears like there may be a bounce here, at least for a day or two:


The DIA looks similar to the SPY, however there is still a bit of room to fill the gap. Perhaps leading to upside early in the week and a close below current levels by this Friday:

The QQQQ's continue to look like the strongest of the group and may still have some upside potential. However they too are approaching heavy resistance levels. Again this suggests a bit more upside, but to remain bearish I would like to see a close on Friday below the open tomorrow.

I am also in the camp that believes we need to see some type of capitulation event occur. A "blow-off top" scenerio where the sellers capitulate. Look at the SPX, it recently broke the upper trendline of the falling wedge, and including all other recent trendline resistance, is this a true breakout or is this a sign of a fakeout setup?

Lastly, I don't have much experience with these time projections however they are something interesting to keep an eye on. The SPX Fibonacci Time Extension lies around these levels.

Depending on which low you consider in the QQQQ's it doesn't matter because you get a Fibonnaci confluence at around this timeframe. Also take notice how the July low was called by these extensions, perhaps something to give more confidence in this indicator:

Also I've been paying attention to UVOL and DVOL. We actually posted heavy volume on the NYSE although it was hidden on normal charts. If you pull up DVOL on Friday you'll notice the last 30 minutes had a huge spike up. This could mean some major players were letting their shares go.

In order to make the chart above, I attempted my first custom study so I could get the UVOL + DVOL on a SPX chart. If DVOL > UVOL then the bar will be red, and visa versa. Here is the code:
declare lower;
input symbol = "$UVOL+$DVOL";
def closeSymbol = close(symbol);
input symbol2 = "$UVOL";
def uvol = close(symbol2);
input symbol3 = "$DVOL";
def dvol = close(symbol3);
plot Data = closeSymbol;
data.setPaintingStrategy(paintingStrategy.HISTOGRAM);
data.assignValueColor(if uvol>= dvol then Color.UPTICK else Color.DOWNTICK);
Lastly I'll leave you with this chart which should summarize it all. Here are earnings and the P/E ratio since 1954. The average P/E ratio is around 16, we currently sit around 19.7. A bit overbought?

Thursday, September 17, 2009
Cephalon on the watch

First thing to realize from these charts is that CEPH has reached a very important resistance level. Both, the daily and weekly chart, show very significant fibonacci resistance at around $59-60.
On the weekly, you can see a 1,2,3,4 wave develop. Then there is an A B wave completed and C might be complete. Fibonacci time studies show that the C should be coming to an end this week (or possibly 10/22 week). Also on the weekly, the teal oval shows a head and shoulder with the top at the important fibonacci levels at 59-60.
The daily chart shows the same resistance level and a double bottom along the trend line.
So, this is getting put high on my watchlist. I will wait to see which way the stock breaks out to. If the $60 level resistance is broken, the next resistance level will probably be near $63-64 level. If it breaks lower (below the trendline on the daily chart), I expect it to fall to at least $55-52 level. I am going to use the Stochs as a guide of where the momentum is going. At the moment the daily chart is showing a bearish momentum reversal and the weekly shows that we are reaching overbought levels.
I considered longing a straddle for this stock. Only problem is that we could end up at this resistance for a while and time decay is terrible. So, if we go lower, I think a simple short the stock is probably a good idea because the downside should be fairly limited. If it breaks up, I think a Back Ratio Call should be good.
Wednesday, September 16, 2009
Oracle short position
Went short at 22.69 after this set up.
ORCL now down to 22.30 and I expect it to go lower after earnings report.
ORCL now down to 22.30 and I expect it to go lower after earnings report.
Tuesday, September 15, 2009
1066 Target Reiterated
After I made my post on Sunday about a 1066 target, two other blogs that I read (Idan over at stocktock, and Kenny at http://kennystechnicalanalysisblog.blogspot.com/) came out with the same target. Past 1066 is a 1080 number and then finally 1121 (the 50% retracement). Lets keep watching our trendlines, but in the meantime, lets continue to buy every single dip in this market (being sarcastic here) because...
ITS RALLY TIME!!!
ITS RALLY TIME!!!
GVBP & SPNG
GVBP has been posting gains of around 40% daily over the past 3 days... For those that think it's too late to get in, I respectfully disagree. At this rate we should see $1 by Thursday. And although the talk of a pump & dump remains eminent, and while shorters continue to bash the stock, the momentum is still stronger than ever. I'm still holding more than half of my position (free shares) although I plan on selling a solid majority just under $1. Good luck!


UPDATE: Wow, that was one heck of a pump at the close. I secured some more funds by selling another portion of my shares at the bell. Now I'm just holding on to a couple hundred shares just to see where this thing will go from here... It looks like we will officially close around .75-.80 -- if more news comes between now & tomorrow afternoon (I don't see why it wouldn't, they have been averaging 3 releases a day) then it is likely we will actually end up seeing $1 tomorrow. I may re-consider buying-in at this point, although there is still room and we have seen crazier things...


Now onto what I openly call "the internets favorite stock". It seems like every message board or stock head that I come into contact with has something to say about SPNG. I've long set my limit for .12 before it's recent ride into the .20's and unfortunately I missed the boat, however a recent major sell-off has occured and now we're back at Point A, .12 -- a very solid entry point for a stock that has a pretty genius advertising campaign airing on Nickelodeon (sponge bob sponges kids??), not to mention car care products that have been hitting the shelves at costco's and hopefully more distributers soon. The problem is that there is a some speculation going on with their books, there 10k is reportedly due tonight and if they prove to have lied about profits, as they are being accused of, we will see an even larger sell off. However, if the news comes and there books look good, we should see one heck of a resurgence. Bottom line, this is the most supported stock on the OTC, and for good reason considering it is a well marketed product with an expanding product line, but if they did lie about their books then this stock will have little integrity left. Watch the news closely over the next day and make your move accordingly. Good luck!

UPDATE: Here's a pretty cool article I found on there advertising campaign in sports.
El Paso Corp.: Back Ratio Call spread follow up

This is a follow up to the El Paso BRC Spread I traded a couple of days ago. I feel managing profits is just as important as analyzing entry situations. So this post is my analysis on that subject.
As you can see, I had hypothesized the stock to break out above the 9.91 area (yellow circle on the daily chart) and had traded a BRC spread on that hypothesis. The stock did shoot up the next day and is up again today in the vicinity of 2%. This has allowed me a near 75% return on investment but I believe the stock is going higher.
I have set up a stop loss for half my position at 10.15 since the stock could face resistance in the teal circle seeing as how that area falls between two key fibonacci levels. Also, the stock is fairly close to the trendlines I have drawn. If the stock breaches these lines we could be in for a complex correction and the stock could move sideways for a couple of weeks. Thus, raking in profits for half the position if the stock falls to 10.15 is a good idea.
My original hypothesis that the stock will probably move to 10.70 area still holds. The momentum on the weekly chart is very bullish and the daily, although overbought, is still bullish. On the weekly chart, a high-high cycle is predicted in a couple of weeks and that would tie in well with a high of around 10.70.
In summary, I will exit half my position at 10.15 and stop loss for the rest at break even. But if we keep climbing, I will keep moving the stop loss along the trendline on the daily chart.
Monday, September 14, 2009
Oracle short position set up

I am not going to write a book this time explaining the analysis but simply point out the main points.
Weekly Chart:
ABC correction seems to be underway, with the A B waves complete. I expect the price to fall to the orange rectangle area within the gray bars' time frame (9/15- 10/19).
Daily Chart:
Very messy chart because figuring out an overall daily pattern was near impossible. The orange rectangles are important levels to watch as well as the Stoch.
Overall:
If the stochs make a bearish momentum reversal, I will short the stock. Ideally this could happen before the earnings in 2 days that would allow me to capitalize on the pullback that may occur after a poor earnings report. However, as of now, the conditions are not bearish enough to short the stock. I will keep a close eye on this and post as updates come about.
Sunday, September 13, 2009
Futures Down 1%
Futures are showing weakness into the open, possible short term reversal set for the beginning of the weak. As shown below the /ES never made a new closing high, and the /NQ is right at resistance. Also the dollar seems to be gaining some strength and setting up for a near term reversal.

The question is whether we are going to see another buy - the - dip scenerio. I think everyone is starting to feel like the top is extremely close and that October is going to be a bad month. We are going to need some bearish formations on the weekly and monthly chart set up going into next month. Last week's weekly candle was not very bearish at all and actually looked pretty bullish to me. The weekly chart shows we should make some type of retest/new high this week before any type of major drop. So we need to see weakness at the end of the week(s) and month of September for any hint of bearish action soon to come.
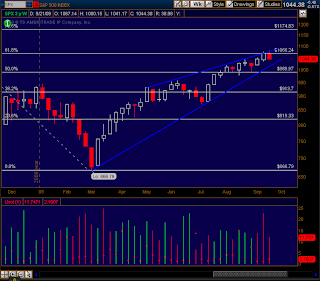
Here are two more charts that I'm looking at. As most of you are all aware of there are two ways to plot the charts, in normal or log (%) scale. Plotting trendlines in the two different scales gives two different results. I've seen everyone now charting the ascending wedge formation in the SPX and when I went to draw the trendline for myself I came up with a pretty interesting example of why you should use both types of charts. Below is a comparison of the Log to Normal scale:


Click Here to Watch


The question is whether we are going to see another buy - the - dip scenerio. I think everyone is starting to feel like the top is extremely close and that October is going to be a bad month. We are going to need some bearish formations on the weekly and monthly chart set up going into next month. Last week's weekly candle was not very bearish at all and actually looked pretty bullish to me. The weekly chart shows we should make some type of retest/new high this week before any type of major drop. So we need to see weakness at the end of the week(s) and month of September for any hint of bearish action soon to come.
Here are two more charts that I'm looking at. As most of you are all aware of there are two ways to plot the charts, in normal or log (%) scale. Plotting trendlines in the two different scales gives two different results. I've seen everyone now charting the ascending wedge formation in the SPX and when I went to draw the trendline for myself I came up with a pretty interesting example of why you should use both types of charts. Below is a comparison of the Log to Normal scale:
Log:

Normal:

Interestingly when drawn to normal scale, the resistance goes all the way back to November support. When drawn on the log scale it cuts through the prices and wouldn't normally have been considered a real trendline. There is added significance to this trendline now because there has been so many touches/tests in the past couple of months.
Below is a chart of my prediction to come over the next couple of weeks. I do believe we will see one last push higher because every chart that I've seen in the past reaches some Fibonacci target. Therefore I cannot see us topping out right here in the middle of nowhere. 1066 is the retracement from the August top of 2008. Seems like a good place to start.

Lastly I've gone ahead and updated my 1937 chart. My chart made its way onto CNBC (note the title and CNBC's terrible mockup). This was actually an old version that Nenner got a hold of when I was comparing the Q's vs the 1937 INDU. I've been in communication with Nenner since I found out he was watching my chart. Apparently it was sent to him by a bank in Europe. I'm not sure if this being reported on CNBC is a good or bad thing. Its neat that it got some recognition, however now that CNBC has showed it I'm sure Goldman Suchs will change a few algorithms in their HFT to avoid making "history repeat itself" :
Here is the chart showing we are very close to the top:

Saturday, September 12, 2009
El Paso Corp.: Back Ratio Call spread after ABC low

Let me start by explaining the weekly chart. Although I have not labeled it, there was a 5-wave gain from March to mid June. This was immediately followed by an A B and C (?) wave. The orange circle near the A wave shows how the stock bounced very neatly off the 50% fib retracement. Wave B tested the high around 10.90 and bounced back down for wave C. Wave C is bouncing neatly off fib levels (retracement of the trend and extension of the AB wave) and the red trendline. Thus, I believe the correction may be over and the bull trend will probably continue to new highs.
I have also done some time studies. These studies (fibonacci extensions of the AB wave, retracements of the trend and the low-low cycles) say that the correction low should be in the range of the blue rectangle. As you can see, the wave C low falls very neatly smack in the middle of the blue rectangle.
Finally, the Stoch is making a bullish reversal in the oversold zone which is avery strong bullish indicator.
To further confirm my analysis, I took a look at the daily chart. The daily is a zoom in of Wave C from the weekly chart. Although the fibonacci price studies are not as neat on the daily chart, the time study (not surprisingly) shows that low should have been made on 9/3 (which it did). The Stoch is still in a bullish trend although it is in overbought zone which is of some concern.
Additionally, the bear channel and the trendline I have drawn in red shows we are just hitting the high and could potentially face resistance at the 9.90 level.
Overall this looks like a high probability set up for a bullish trade. I have been looking at Back Ratio call spreads and the following looks like an excellent trade:
Buy 30 Oct 09 $9 Calls
Sell 15 Oct 09 $8 Calls
Although the prices will probably change a little as the stock moves (I plan to enter at 9.91), right now this trade will cost $579. If the stock should rise to the Wave B highs, I should make around $1000 (depending on time). At expiry my max loss is $2561, but I am setting a max loss of around $400 with a stop loss exit at 9.63.
Update:
Price broke above 9.91 today and I went long the BRC spread. Unfortunately I got kind of screwed on the bid ask and got a terrible price. My breakeven on the spread is 10.10 today and each day it falls as time decay hurts. This has made me move my stop up to 9.75 and also reduced my profit potential at 10.70 to a mere $600. Still, the stock moved to as high as 10.02 today and my hypothesis seems to be coming true.
Thursday, September 10, 2009
Put/Call Ratios out of whack
When I learned about P/C ratios I read ".80 - 1.00 is usually normal. A ratio of .70 is seen as very bullish and 1.10 is usually seen as very bearish sentiment by the 'smart money'".
I randomly decided to check the P/C ratio for various indices, futures, and my holdings today and was surprised. Below is a summary:
QQQQ - 1.384
SPY - 1.424
/SI (Silver) - 1.751
/NG (Nat Gas) - 1.031
/CL (Light Sweet Crude Oil) - 1.758
/GC (Gold) - .458
The smart money seems to think we are headed down and big time. Yet the rally continues with no end in site. All the momentum indicators are pointing up; Breadth seems to be in good shape; and advancers far outweigh the decliners. Who is buying the stocks when it seems like everyone is buying puts?!
Hell if I know. All I know is that I am holding off on a shopping spree for puts and short positions while setting very tight stops on my long positions. I would rather miss out on a few percentage points by arriving late on the bear bandwagon than get wiped out while the market continues rallying. I advise you do the same.
Except gold; buy tons of gold...
Penny Stock "Sure Thing" Of the Month: GVBP
I know what you're thinking... There's no such thing as "sure thing", and while I'd normally tend to agree with you, this may be the closest thing we have seen thus far. GVBP, Genova Biotheraputics, has been ON FIRE over this past week, and I don't see a roof in sight!! This company is similar to the likes of CTIC, HTDS and other biotheraputic/pharmacutic companies that have already seen gains of nearly 1000%... And with President Obama's health care push, and the CONSTANT PR on the part of GVBP this is a sure winner!!! Let's take a look at this week alone...


As you can see this thing has already made quite the run up (more than doubling in price)... Not to mention a nice .03 run up at today's close, leaving room for an exciting gap tommorow... ON THIS NEWS AT CLOSE... As things thing continues to acquire patents, and non-chalantly throwing around figures in the billions this is one stock that I would definitely keep an eye on... Good Luck!
Tuesday, September 8, 2009
Gen Dynamics Backratio Call
I am going to split the explanation for this trade in two sections: Financial and Technical.
Technical Analysis
I found this trade using the pattern finder on TOS and initiated my analysis on a technical level. So, logically, this comes first.

Here is a legend of all the drawings on the chart and I apologize for the messy drawings. Please read on to see what the drawings mean.
WEEKLY LEGEND:
Red Lines: E-Waves
Blue Fibs: Fibonacci extensions of the 0-1 Wave.
Green and Black Lines: Important Fib levels from the daily chart (explained later)
Grey box: The Daily chart's time frame
DAILY LEGEND:
Red Lines: E-Waves
Green Fibs: Extension of the 2-3 Wave
Blue Fibs: Extension of the 0-1 Wave
Purple Fibs: Extension of the 0-3 Wave
Now that we know what the Fib lines are, I can begin my explanation. On the weekly, we completed waves 1 and 2 and are in the middle of wave 3. This means that theoretically we have some significant upside potential and can also expect a corrective wave 4 before the stock continues upwards. Also of note is the fact that the Stoch indicator is showing some major overbought pressure. However, the fast line is still above the slow and a momentum reversal has not occurred, indicating that wave 3 is not yet over.
The question then is when will wave 3 be over? Looking at simply the fibs on the weekly (blue lines) we have 3 important levels to look at. The 100% extension coincides very closely with the channel line and is probably going to be an important level to watch. The yellow box is also extremely important and the reason for that can be found in the daily charts.
On the daily, firstly, there is a bullish momentum reversal (albeit very close to the overbought level) that could mean a healthy upward movement.
Additionally, the daily chart has formed an E-wave as well and is in the middle of the 5th wave. I believe that the end of this 5th wave on the daily will coincide with the end of wave 3 on the weekly. I have drawn some important and common fibonacci extensions (explained in the legend). The areas where these fibs are clustered together are going to be important resistance levels. Thus, the grey boxes on the daily chart are going to be important resistance levels. The green and black line and the yellow box on the weekly is drawn based on these fibonaccis. That is what makes the $63-66 level very important.
To top it off, this same level is very close to the top of an inverse head and shoulder on the weekly.
So as you can see, all the technicals have lined up and indicate that the stock should move higher and after struggling in the 63-66 level. Wave 5 is still too unpredictable on the weekly and I would be hesitant to make any guesses about that wave.
Financial
Financial analysis could play a key role in this stock because earnings are due on Oct 28th. Admittedly my financial analysis on this is quite shotty. I merely glanced at the ratios and determined they looked good. However, I did research the news for some time and found good news all around.
The company is expanding operations overseas; just won a $31 million contract from US gov't; positive M&A activity is going to allow the company to expand outside of the defense industry; and so on. So based on all this I at least expect GD to give earnings estimates that outperform analyst expectations.
The Trade
I realize I have already written a book, so I am going to keep this section short.
Bought a Back Ratio Call
+5 60 Nov Call
-3 55 Nov Call
In short, I am going to hold on to this until the 66 level (where I can probably make around $200) then sell off parts of the trade. I am hesitant to put a stop on this because if the stock falls to $55, I will be $250 in the money. Theta is really my only enemy. Volatility is high and I hope it remains high. Seeing has how the stock has nearly doubled since March, I expect it to continue going up rapidly or crash rapidly.
Monday, September 7, 2009
Weekly Candle Pattern 08/08 vs 08/09
I'm a fan of looking back to see if history tends to repeat itself by finding patterns that have happened before and applying them to today. Here is one that I found last week that I thought was interesting enough to share with you. When I found it I thought it was done after we had our 200 point drop but it seems the market closed on a positive note and was able to continue the formation. If there is any truth to this pattern we should not close see any prices above 1028. Interestingly enough this pattern is also the top right before the October free fall made last 08. Could there perhaps be a repeat?


Thursday, September 3, 2009
The QQQQ
I have been looking at some charts and wanted to share my analysis on the QQQQ (I have vested interest in the QQQQ).
First let us take a look at the QQQQ weekly.

Firstly, the Stoch on this chart has been a fairly strong indicator of when to buy and sell. As you can see, the Stoch called the March low within one bar. Also called the May and June corrections (gray rectangles). We are seeing a similar pattern once again today (mustard rectangle). However, the correction has been bouncing off the trend line I have drawn. Coincidentally, if the QQQQ reaches the trendline this time, it is also the 61.8% fib level. So I expect this bounce to happen in the green area.
Next the daily presents a similar picture.

The key difference is that the stoch, which once again, on these settings, has been a good indicator for QQQQ, is showing a strong bearish momentum. However, like I said, we are still not breaching the trendline nor the August lows. At the moment seems like the price is bouncing off the fib level. $39.04 is going to be a very important level based on the weekly and daily chart. Also take a look at the solid blue line which is going to serve as the next support after 39.04. This is going to be an even more important level because if this is broken, there is no support until around the $37 level which could be very interesting. And looking at the intraday chart, I am concerned that we could even reach those levels:

As you can see a bear trend has been established on the intraday chart as the price has taken out support after support. As I said, right now we are bouncing off the fib but even that was taken out at one point.
So from a trading stand point, what am I doing? I already have puts for the QQQQs and have been selling OTM calls. I am hedged, however, with long calls at 35 strikes. I also have orders to buy more puts if QQQQ goes below 39. If this happens, I will play this with a very tight stop because the price could fake down and then bounce right back. If the price does not do that, my target is $38.46 for the QQQQ.
