Real Account
SP500 reached a high of 1147, a fibonacci level I had identified previously, and closed 25 points lower today. I missed that boat until this morning. But I do believe we are headed lower. My last two trades have been closed for small losses because the reversal I predicted did not come. The signs are all there, I think it is just a matter of time.
Virtual Account
Using the heat map, I identified a few opportunities last week. I shorted JOYG, BIIB, and VZ last week. VZ and JOYG got stopped out for a loss while BIIB is still an open position.
This week, JOYG remains as a possible sell position. Additionally, GILD is an excellent sell candidate. Also on the sell watchlist are:
AAPL
CHRW
DD
AMZN
No buy prospects this week, again.
-wown
Stockjockz.blogspot.com
Thursday, September 23, 2010
Monday, September 13, 2010
Trade Update and Heat Map Update
Trade Update
In my previous post I said I was expecting a reversal on 9/7. On 9/8, SPX fell aroudn $11. But over the next couple of days, SPX rose, broke the 1104 resistance and closed today at 1121.90. Luckily, I closed out most on my position on 9/8 and closed the entire position out for around 15% profit.
As far as what's next, I think this is a fake break out and we are still due for a reversal of some significance. Reason being that we created a double top today just below 1125, another resistance level I have stressed in the past. Additionally, all my indicators are showing bearish signs. I think we might ahve an up day tomorrow before selling off for the rest of the week. However, I am waiting for a confirmation (on either side) before making any bets. I will keep you posted.
Heat Map
After many months of delay, bug fixing, errors, and frustration, the heat map is FINALLY complete in its entirety and ready to use. I have been testing this version for a week on the DOW 30 and NASDAQ 100 and have not seen any errors as yet.
Note: if you are unfamiliar with TD studies, I suggest a google search on TD setup, TD combo, and TD sequential before reading on.
This version features:
1. An accurate TD Setup Buy/Sell counts
2. Accurate TD Sequential counts (With an option to make aggresive counts)
3. Accurate TD Combo counts
4. TD Support and Resistance levels (when 0, it is N/A)
5. Count refresh on market close each day (so, unfortunately, it cannot be used for intraday trading. Perhaps the next version will include this feature).
I plan to test a trading system using this heat map by setting up a virtual account of $100,000. Every day (or as much as I can :) ) at market close, I am going to filter the table for those stocks hitting one of the following criterion:
1. 9 or more on Buy/Sell Setup
2. 12 (only because I am noticing that often price reverses at 12 rather than 13) or 13 count for sequential.
3. 12 (only because I am noticing that often price reverses at 12 rather than 13) or 13 count for combo.
I will analyze any of the stocks hitting TWO of the above criterion (within a 5 bars of each other) and see if the stock is at a Fibonacci convergence level.
If, so, I will, trade ATM options (in the direction that the study predicts) for a position size nearest to $5000, setting a stop loss of $1000 (or above Fibonacci level, whichever is less) and target of the support/resistance as stated by the heat map.
My exit strategy will be to sell 50% of my position when we reach 50% of the way to the target and move stop loss to breakeven for the rest of the position. Otherwise, sell another 30% at target and set a trailstop of 5% (on the option) for the rest of the 20%.
At any given time, I will hold no more than 5 put and 5 call positions and no more than $20,000 invested.
Be on a lookout for a weekly update of what stocks are on my watchlist that week and a summary of last week's performance. I have a strong feeling that the system will work well - if not at least I don't loose anything. Today's update is below:

No immediate trades but the following could be potential Put trade opportunities:
1. QCOM: 7 on Setup and 11 on Combo mixed with a declining oscillator right around an important Fibonacci level makes buying puts on QCOM quite attractive. However, we did recently break downward Fib. channel meaning that this could simply be a small retracement.

2. VZ: Similar situation as QCOM.

3. BIDU: Approaching the top of a channel that BIDU has been adhering to for a while now.

4. BIIB: Hit 13 almost in junction with a setup completion after a lot failed perfection attempts at completing the sequence.

-Wown
stockjockz.blogspot.com
Wednesday, September 8, 2010
My Views on Trading Implied Volatility vs. Price
In my previous post I mentioned that I no longer want to trade IV because:
a) I am not as good at trading IV.
b) When you trade IV, you are essentially trading price so keep things simple and trade price.
Below is a more technical explanation of the above two statements.
Conversation on InformedTrades.com
I post a copy of this blog on InformedTrades. The following conversation took place between myself and another user (Forexer) on InformedTrades:
Forexer:
Here you about volatility. You think volatility follows the normal distribution? Price doesn't. Price is lognormal. They have skews very frequently and that is exactly what makes them tradable. I rather sell volatility than buy them because high IV usually erodes slowly at the least or maybe revert back to the mean. We can use statistics in trading volatility to a great extent. But we know its not all about volatility
Me:
Volatility is supposed to follow a normal distribution from what I understand. Reason being that the means of multiple lognormal distribution should be normally distributed. Since the means of the multiple lognormal distribution is basically what volatility is, we should conclude that volatility is normally distributed (correct me if I am wrong - been a while since I studied option theory).
But like price, I would argue volatility too should be lognormal because although volatility is supposed to measure the increase in price movement, [implied] volatility rises when price falls and vice versa. So IV really isn't measuring the variation in price but rather the market's belief or reaction to negative price movement. So, since price distribution can be skewed and volatility is simply the reaction to price movement, it too should be skewed.
Which brings me to my original point: if you trade IV's, you must take into account the fact that negative price movement will raise IV. So, you should long IV when you expect price to decline and vice versa. But why would you go into such complicated calculations when you could simply trade the price in the first place.
Hope all of that makes sense
Let me explain that a little bit. A lognormal distribution looks like the graph below:
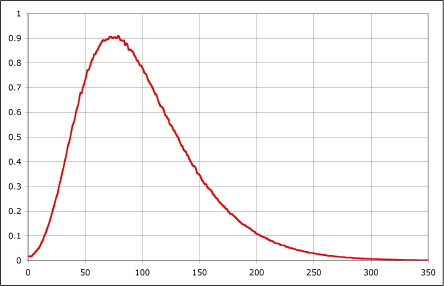 Source: danvk.org
 The reason for this lognormal distribution is quite intuitive. The price can never fall below zero so the lower limit is set at zero. The upper limit is infinity however realistically speaking the price will be centered around the mean (which in this case is around 75).
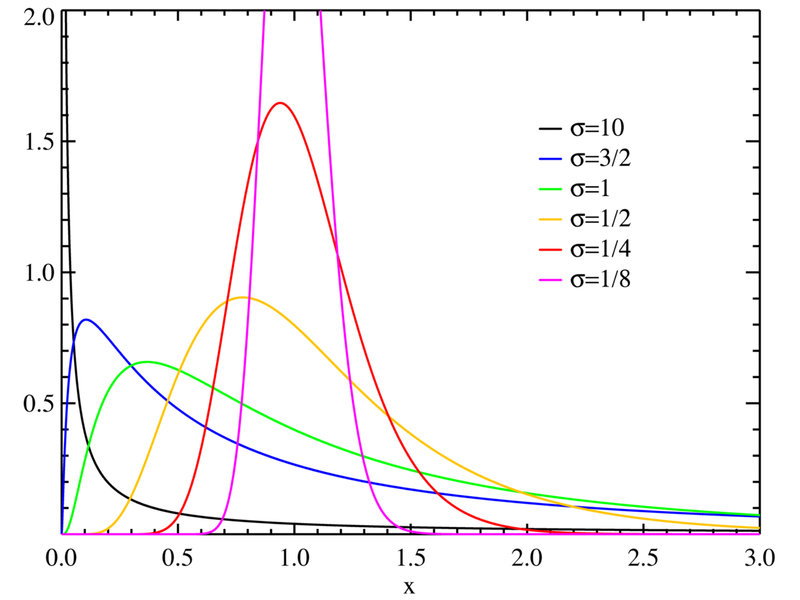
However, different set of price data for the same security can have a different lognormal distributions. The difference in this variation arises from variations in the mean and the standard deviations. For example (only illustrative), in the month of August, SPY could have a mean of 110 with a standard deviation of 10. In August, however, the average was 105 with a standard deviation of 20. These two data sets would yield two different lognormal shapes. This is illustrated in the graph below:
Theoretically, the means (averages) of all these lognormal distributions will have a normal distribution. In other words, if you created a data set of the means of all of the lognormal price distributions of a security and plotted it, the distribution would resemble the below:
Theoretically, this normal distribution is the volatility of the stock. But all of this seems counterintuitive to me. For one, remember that a normal distribution does not have a lower limit. So essentially you are allowing for negative prices - even if the chances are one in a billion. Additionally, and this is simply speaking for experience, IV tends to fall a lot slower than rise and this is clearly not represented in a normal distribution. Thus, there is a BIG disconnect in what IV actually is vs. what it theoretically is.
In my mind, IV is simply another way to say what the option's price is - which itself is simply a derivative of time value and underlying's price. Theoretically IV is supposed to imply how much the market believes the stock will move by expiration, but in truth, I believe it simply says "how afraid are people that stock will fall". The more afraid they are, the higher the IV (yes, even the call IVs - although this is often overlooked simply because the falling price deteriorates the price of calls).
Continuining with the coversation from above:
Forexer
Yea. Hats off to you. I'm not a math guy but i hear you on the IV being lognormal. Does IV increase on large updays?
Short answer: No. If anything IV falls on large updays. Take a look at the chart below of the SPY:

The chart shows SPY price plotted with average implied volatility. Granted this is not a very thorough study of IV vs. Price, but you can clearly see:
a) IV rises a lot quicker than it falls.
b) Price and IV are negatively correlated (When price rises, IV falls and vice versa). Notice the price vs. IV from Feb to May and then again from late June to August.
-Wown
stockjockz.blogspot.com
Tuesday, September 7, 2010
Another Reversal
First week of September saw a nice rally in the markets and thankfully I was able to ride most of that move up. In fact, a friend of mine asked me "A lot of financial journals are claiming that a big sell off is coming. Should I short?" I answered "Yes, but only if SPX breaks the support at 1040". That day SPX went to 1039.88 and rallied. A couple of days later SPX went to 1039.35 and rallied all the way to 1010.
Meanwhile TOS updated its software and in the process all my charts were erased. So for a while there I was trading on gut instinct because TOS support claimed that the charts would be available soon.
On Friday I finally contacted TOS support and asked them the status. Turns out you can reverse an update and that is exactly what I did. When I got my beloved charts back I saw that SPX was trading just below 1105 resistance I had found a while ago. Not only that but the Demark countdown and setup hit 13 and 9 respectively. I quickly liquidated my long calls and now I am sitting on a put vertical. I expect the price to drop to at least 1080. However, I may be inclined to cash in the profits (currently at 4%) if the oscillator breaks the downward trend (see red line).

In other news, I am going to try increasing my position sizes. My performance and price reversal predicitions have been very accurate lately and I believe it is because I have finally found a combination of fibonacci trading techniques and indicators that work. So, feeling more confident, I am going to increase my risk apetite. Also, most of my trades have some sort of an 'insurance' policy now where even if I am wrong, I have a counter trade that at least helps me break very close to even. Of course, I am still keeping my positions and max loss at around only 4% of my account.
Finally, I have been considering what has helped me perform better lately (Compared to 8 months ago when I was down 20% of my account). First, I am not trading news anymore. By the time retail traders get wind of the news and act on it, it is almost always too late. It is also no use trying to predit the news because again, if you are making a prediction, you can bet a lot of others are as well and acting upon it.
Secondly, I have been sticking very strictly to my trade plans - taking emotion completely out of the picture. It is tough watching your trade take a 50% hit and having the patience to let it play out. I think I have finally managed to learn that lesson.
Finally, I realize that I am terrible volatility trader. Many experts out there claim that if you trade options you must trade the implied volatility. Also, they claim that since volatility usually operates within a given range, it is easier to predict. I say all of that is a bunch of crap. You have to know the direction of the move unless you are 100% delta neutral (Which is theoretical anyway) all the time. Maintining neutrality alone costs a fortune in commissions.
Additionally, and maybe this is just me, predicting volatility is just as hard, if not harder, than predicting price direction. Reason being that IV is a derived mathematical and theoretical number to which you cannot assign technical studies. So, I feel people are better off just taking advantage of the leverage properties of options to trade the underlying.
-Wown
stockjockz.blogspot.com
