Market Summary
To start off we had a very interesting week. The market played out exactly how I thought it would. For a bearish topping candle on the weekly timeframe we needed to expect new highs during the beginning/middle of the week and a strong close near the lows. We did exactly that, so the highs on Tuesday and Wednesday were no surprise to me.
There are several sources now saying that this rally from 666 has topped. According to Elliott Wave if we break below 1039.47, it is almost a guarantee the safest strategy will be to sell into strength because we are going much lower. However the bullish alternative says we can still make one last push to around 1097-1122 [unless we break 1039.47]. Therefore I expect some confusion early in the week with a clarification on Tuesday/Wednesday which way the market has decided to go. I'd say a break above 1058-1060 may lead towards the bullish alternative and any break below 1039.47 is very bearish.
1938 vs 2009
Instead of updating my comparison chart I figured I would show this chart which compares 1938 vs 2009 in much more detail with daily candlesticks. [Interestingly, Yahoo is actually good for something because they are the only source that I can find that has candlesticks for 1938, all other sources just show dots on the data feed.] I've mapped out the rally which ended the 1938 rally and it definitely has a very good correlation to our current wave pattern. The letters on the chart are only used as reference points.
My 1066 Target & Distribution
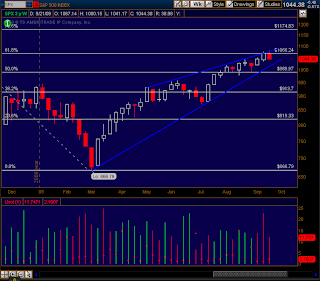
Like I had stated in my earlier blog post, 1066 looked like an important level to me and I assumed the market needed to reach this before any major turn lower. Although it eventually pushed higher to top at 1080, the market seems to be obeying this 1066 level on the weekly time frame. This gives an even stronger signal to me then the daily timeframe.
Also in my chart is an updated version of my UVOL/DVOL indicator. As you can notice by the color of the last 3 bars, the last 3 weeks have seen sell volume greater than buy volume [also at an increasing rate] even though prices have headed higher. This is of course a bearish divergence. The last time we had 3 weeks of distribution was back in July however if you notice the the volume is much heavier this time around. I think the last major selloff was more confusion and people shorting rather then distribution and selling.
The TRENDLINE
As you know we have been building up a bearish ascending wedge during this entire rally. Basically we have been consolidating up for a new move lower. If I were to believe in this rally I would have rather seen some nice pullbacks along the way. Also I've seen reports say we've done this before (go up with no consolidation) and I looked back to the 1970s rallies where this has happened...and what followed was just another breakdown to new lows. Anyway there has been a trendline holding up this entire rally. Here is just one possible way you can draw it which connects all the lows. If this is correct we better see some quick upside or it may be a signal we are breaking down.
The Dollar and Commodities
Since I went over these last week I might as well give an update since they are very important and will give confirmation of what will happen on the equity side.
The Dollar
The dollar finally is gaining some strength. There may be one last push downwards, but I tend to doubt it. If the market has topped, that means the dollar has bottomed. You will also see the effect of this "bottom" on commodities. If the commodities have built such bearish patterns I cannot see them regaining strength. It is for these reasons I tend to believe the dollar has bottomed.
Gold
Gold is back below 1000. I don't believe in the rally whatsoever. If the dollar is going to bottom which I believe it will, then gold is going to go right back down. No breakout here..... yet.
Silver
Silver continues to look bearish. Would have been a great short last week when I highlighted it breaking down. Also something interesting to note is that silver has lagged gold the past couple years. If gold is to make all time new highs why isn't silver?
Crude
Crude chart looks the worst of all the commodities. Head and shoulders breakdown. Just think if the dollar is going to rally here where does that leave Crude? $50, $30, $20, $10?
Natural Gas
I missed it. I had made a post about a month ago highlighting the trendline in natural gas. I guess I never noticed it because of the lackluster correlation between UNG and natural gas. Natural gas has jumped well over 100% the past couple weeks, but UNG hasn't moved. Oh well.


1 comments:
Nice, I like your market updates.
Speaking of, looks like we bounced off the August support levels (1040ish level) on the S&P. Up almost 2% today. We still have the double top around 1080 which, as you mentioned, if broken could be very significant.
I have a calendar trade for the SPY that is profitable between $98-$110, similar to what I did for accenture - good to trade while this market decides which way to go. If I get a chance I will post it.
Post a Comment