Last week I stated a target of 1066 was to occur so I expected a rally, however this week I'm saying that there is a possibility we see a top. That doesn't mean that it will happen because we can just travel to the next inflection point. But let me show you some charts that explain how the "planets have aligned".
Here is your "currency" commodities, copper, silver, and gold. Copper looks the weakest and appears to have setup a double top on the weekly right at the 62% retracement:
Silver appears to have put in a shooting star and reversal signal due to fridays action. I do not believe the buy the dip scenerio in silver as much as I do in equities so I do believe silver will undergo a correction.
If silver and copper fall, so will gold. Also gold is in a heavy resistance area. 1000 might have been a huge hurdle but it still is not at all time highs:
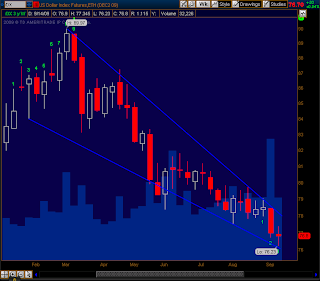
If these commodities will go down, it will because the dollar is going to bounce. Sure enough the dollar hit falling wedge support and appears like there may be a bounce here, at least for a day or two:
The DIA looks similar to the SPY, however there is still a bit of room to fill the gap. Perhaps leading to upside early in the week and a close below current levels by this Friday:
The QQQQ's continue to look like the strongest of the group and may still have some upside potential. However they too are approaching heavy resistance levels. Again this suggests a bit more upside, but to remain bearish I would like to see a close on Friday below the open tomorrow.
I am also in the camp that believes we need to see some type of capitulation event occur. A "blow-off top" scenerio where the sellers capitulate. Look at the SPX, it recently broke the upper trendline of the falling wedge, and including all other recent trendline resistance, is this a true breakout or is this a sign of a fakeout setup?
Lastly, I don't have much experience with these time projections however they are something interesting to keep an eye on. The SPX Fibonacci Time Extension lies around these levels.
Depending on which low you consider in the QQQQ's it doesn't matter because you get a Fibonnaci confluence at around this timeframe. Also take notice how the July low was called by these extensions, perhaps something to give more confidence in this indicator:
Also I've been paying attention to UVOL and DVOL. We actually posted heavy volume on the NYSE although it was hidden on normal charts. If you pull up DVOL on Friday you'll notice the last 30 minutes had a huge spike up. This could mean some major players were letting their shares go.
In order to make the chart above, I attempted my first custom study so I could get the UVOL + DVOL on a SPX chart. If DVOL > UVOL then the bar will be red, and visa versa. Here is the code:
declare lower;
input symbol = "$UVOL+$DVOL";
def closeSymbol = close(symbol);
input symbol2 = "$UVOL";
def uvol = close(symbol2);
input symbol3 = "$DVOL";
def dvol = close(symbol3);
plot Data = closeSymbol;
data.setPaintingStrategy(paintingStrategy.HISTOGRAM);
data.assignValueColor(if uvol>= dvol then Color.UPTICK else Color.DOWNTICK);
Lastly I'll leave you with this chart which should summarize it all. Here are earnings and the P/E ratio since 1954. The average P/E ratio is around 16, we currently sit around 19.7. A bit overbought?


0 comments:
Post a Comment