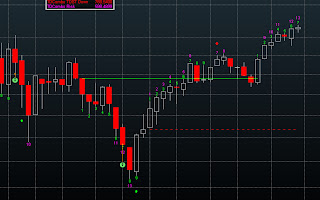
In addition, Demark studies also believes that a major reversal may be set to occur within the next 1-2 weeks.
I actually just came across the Demark studies and I'd have to say I'm glad I've found them because it just adds another tool to my arsenal. Seen pictured above is the TD Combo study. I'm still learning but from what I have gathered a purple 13 means look out for a reversal, and a green 9 says look for a correction. Amazing the weekly time scale called the March 2009 bottom. So I say lets give it a shot and see what it does this time around. Of course these indicators (RSI/MACD/etc. & E-Wave & Demark, etc.) aren't going to guarantee you the right side of the trade 100% of the time, but it's at least best to put the odds in your favor.
If you'd like to follow more detailed analysis on Elliott Wave please check out the following blogs:
And if you're interested in Demark, here is one that I recently found. Reading through his analysis he seems to be pretty good:
http://dailydemark.wordpress.com/
Lastly here are some additional blurbs running through my head since I do not feel like writing a book right now:
- Shanghai Index down 6%, and we are lucky to go down .06%? How are we going to be manipulated next?
- Is the dollar going to hold trendline support, is it going to form a falling wedge, or is it just going to new lows?
- If the dollar rallies, commodities shorts will should be #1.
- I'm staying away from financials and would rather be shorting the [over - extended] leader of the rally (Nasdaq)
- The Demark studies D-Wave also has said the top came in on Friday, coincidence?
Lastly here is an updated 1937 chart:


0 comments:
Post a Comment