Thursday, October 29, 2009

They Did It Again


Somehow the bulls managed to bounce this market to make it appear bullish once again.I had been mentioning that I was not entirely convinced that yesterday's break of the trendline was entirely bearish. It was not a surprise because they pulled this trick in July in regards to the head and shoulders. I'm looking at this in two ways:

1) Just like in July they got everyone short on the break of the trendlines (this is evident in the heavy selling volume in the index ETFS and market breadth). The short covering rally will attract more buyers and the market may attempt a run to 1121, and perhaps even 1230 (doubtful).

2) We've been trained to buy the dips, but the trendline is now broken. In addition so many others things that I've already pointed out give strong evidence that the top IS in. Therefore people will begin to buy these dips, but the market will make a quick turnaround next week and all these new buyers will allow the market to go lower.

The chart above shows a regression channel on the S&P. It just shows how systematic this uptrend has been lately. Up and down making higher highs and higher lows. Take note that yesterday's and today's actions are very typical for a reversal. I like this 2 day candle pattern even more than a hammer or shooting star. It typically occurs by having two full bodied candles, one up and one down, going through important support/resistance in the 1st and reversing back and saving support/resistance in the 2nd.

The Nasdaq


The Nasdaq and Transports both were weaker than the Dow today. However any further upside would favor at least a retest of highs, disregarding my #2 scenario described above. Note the major RSI divergence occurring on the daily. Just as we've had a nice uptrend in stocks, the RSI has continued in a nice downtrend. Not a good sign.

S&P 400 Mid Index


The S&P 400 Mid was a favorite for me back in December when I was comparing the charts to the 1938 scenerio. I liked the structure a bit better. It seems to be a mix of the Nasdaq and the S&P 500. Notice how the retracements have played a very significant role in defining support. Currently it appears the Mid is obeying its rally trendline, unlike all other indexes. Support was found by the intersection of the trendline and the 50% retracement. Perhaps this is the one to continue to watch. This chart tends to make me believe we will reach the 61.8% retracement.

McClellan Oscillator


To substitute my normal discussion on market breadth I'm posting a popular picture posted on many blogs recently of the McClellan Oscillator. For those unaware you can read investopedia's definition here. You can notice that the oscillator was significantly in oversold range. In fact it was at it lowest levels since the rally began, and as levels such as the November and March Lows. It also appears as if there is a very good possibility we will see a bit more upside, perhaps until it gets to -100 in the chart above.

Whats up with Goldman?
GDP came in better than expected today at 3.5%. Yesterday Goldman Sachs downgraded their forecast from 3% to 2.7%. My questions are why do they update it the day before, why wait until the last second... (they do this a lot I've noticed). Also you would think that with new data they would have a more correct number, not make their forecast worse. Typically you think of Goldman as the cream of the crop, and if they are making these types of mistakes you almost automatically think manipulation. This plays into the #1 scenario I posted above, and yesterday gave Goldman the perfect opportunity to go long for the last major move up in this rally. 

Perhaps Goldman knew that the GDP would come in at 3.5%, but instead they lower their forecast. (What do they got to lose by doing so) They know the market is in a state of fear and confusion, being down a good 5% from highs and breaking the major trendlines. They figure if they can get in investors' heads that the GDP number is important for the markets (which its shown its not) that they can make some money on the long side in an oversold bounce.

I don't know if I necessarily buy into the whole manipulation thing, but I can tell you a lot of people do. I will say theres a possibility this actually does occur, but perhaps people just cannot understand the reasons why markets move. As humans we typically want a reason (or an excuse) to why things happen the way they do. Perhaps blaming Goldman or the Fed is what we do when the market makes a move against us. Someone else has to get the blame, not ourselves.

Please check these links on Zerohedge for more information on Goldman and the GDP numbers:


Wednesday, October 28, 2009

Trendline Broken


Recent Market Happenings:

  • Major trendlines are breaking
  • Adv/Dec ratio spiked today
  • Down volume taking over
  • Huge volume flowing into UUP (US Dollar ETF)
  • Huge volume flowing out of SPY (S&P 500 ETF)
To briefly discuss today's events. We broke the trendline early in the morning and as the day progressed and people began to realize the trend would not be saved by the close the sell volume started to pick up and indicies drifted lower during the day. The Dow only being down 100 was not enough to justify what happened in most stocks. Although there were some that held up, such as V and AMZN, most stocks were down 3-5% on average.

This is just a small list of many things we've seen the past few days that continue to support further bearish action. However, I'm beginning to lean towards a bounce, but the trend is now down. Any strength should be a selling opportunity. Tomorrow might be a non event, but Friday is the end of the week and the month. I should have some exciting monthly charts for the weekend.


Transports


Double top in the transports with a target close to its 38.2% retracement.

Airlines Index:


Here is the Airlines Index, XAL. I like following the airlines since they seem to have a mind of their own. They can be very profitable and often go up 100% on major market moves. The reason they are allowed to do so is because they go down pretty hard as well whenever the market turns sour. You can notice in the 3-Day chart above that they don't really have the normal swings/consolidation seen in other stocks. They typically either go up or down. Right now, they are picking up steam to the downside, I wouldn't be a buyer until 22 even if I was bullish.

LZ Update:


I'm still watching this one like a hawk. It seems every time I update its back to the same price. Lets watch that  red line. A close beneath there on Friday will be very bearish. We have plenty of time to get into this one, as it has plenty of room to fall.

Portfolio Update

Another month has gone by and what a month it has been. I have been all over the place interviewing for jobs as I graduate from college (in fact right now I am in New York's La Guardia airport right now) and so my portfolio has been feeling a bit neglected - and the numbers show that too!

YTD Return:
5.10%
Month's Return:
-2.07%
Number of Trades This Month:
47
Back Ratios:
2
Calendars:
4
Stock Trades:
15
Straddle:
1
Vertical:
1
Adjustments:
24


As you can see most of my trades were adjustments to outstanding positions and I mainly focused on exiting my trades. Reflecting that is the fact that I only have 7 positions open right now and most of those are fairly simple trades. As I mentioned I have been busy this past month and next month is not looking good either (must enjoy last semester of college!).

Most of my trades were profitable or break even and some even returning close to 300%. What really brought me down was a calendar spread I had on Total Inc which for some unexplained reason jumped like 7% in a day that hit me for a $1700 loss - compare that to my total loss of close to $800. Unfortunately, this was 2 days before October expiry and so I could essentially do nothing about the trade. I simply should have hedged myself against a possible jump like that, but then my return potential would have been nearly nothing. I had nearly 80% probability of profit and less than 5% chance of losing more than $200. Sometimes you do everything right and you still lose.

My current positions are mainly volatility plays because I strongly believe volatilities will rise (already up around 30% in the past week! I called that last week! If you are wondering what my target for the VIX is: 30.50). I am also net short on the SPY (have been since last week) and so that is making me decent profit.

I will try to post more of my trades here and my strategies behind them. I think it helps me make better decisions as well as learn.

That wraps up my October update. Good luck and happy early Halloween.

-By Wown
StockJockz.blogspot.com

Tuesday, October 27, 2009

Trendlines and Such


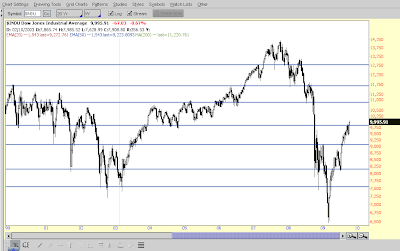
Updated Dow Jones chart. I've done a lot trying to determine which trendline we should be watching. Each index has a different trendline and in different scales. Most are starting to break, in fact the SPX and Nasdaq Logarithmic trendlines were broken on the last dip.I believe the blue trendline on the DOW is the most important however because of the fact that it has had 4 touches now.


The transports continue to show weakness. We certainly don't typically go up very much the next day with a chart looking like that. I'm looking for a possible test of the double top support at 3655 tomorrow and a bouncer higher. Otherwise any more weakness will hint at 3400 within a month or two.

EUR/USD:


Long term EUR/USD shows a possible retest of a broken trendline. If this is truly what it is, expect new lows/possible retest of 2002 in the EUR/USD in the upcoming months.


I switched to the EUR/USD from /DX because I didn't like the data feed for TOS for the futures contract. I believe this should be closer to the true trendline you should be watching. It should correlate well with the Dow Trendline above.

Long Term DJIA Chart


Yearly Chart


I attempted to come up with a price target by drawing a channel that markets the very lows of the major recessions/depressions. These price dates 1942 and 1974. They seem to draw a pretty decent channel. I then noticed that every major downturn in the market has started at or above the channel and then has not ended until it touched the bottom of the channel (this is in fact the definition of a channel, but....). With that said it would make sense to me that we should touch the bottom of the channel which correlates to around 5000 in the DJIA by 2012.

Another Way:


Monday, October 26, 2009

Stars have aligned, how far do we go?


Today we saw a nice bounce in the dollar, perhaps even a reversal, which sent the Industrials swinging from up 100 points at the open to closing down 104. That would be a 204 point drop intraday controlled by the bears (mainly occuring all within an hour's timeframe). These are some strong selloffs on heavy volume to fuel this downturn in the markets.


Market Breadth and Trendline


My breadth ratio signals the heaviest downward breadth in the markets we've seen this entire rally. We've had two back to back 7:1 Down days in regards to NYSE Up to Down volume. Even SPY volume hints at distribution over the past 4 days, which has shown a significant boost in volume to coincide with this selloff. With that said I cannot rule out further upside until the trendline breaks. I'm hoping we see a gigantic selloff on the break and not another fakeout. That trendline seems to be something everyone is watching, very similar to the head and shoulders back in July. We all know what happened then.


The 61.8% Retracement


Going through my charts I noticed that the QQQQ's touched their 61.8% retracement to the penny on 10/21/09. I believe you could try buying puts here and while setting the stop at 43.82. The bullishness behind the big technology companies is still evident in the market. Eventually it will fall like the rest.

Transports


The transports never made new highs as I've posted before. Their chart continues to look more bearish each day and is dangerously close to breaking the trendline.


Silver vs Dollar


This is how most commodities looked today, including the EURUSD.Everything got slammed while the dollar was only up less than 0.70. Imagine if the dollar goes up $3 what will happen. There was once 3% bulls in the dollar, this also correlates well with the time Gold was all over the news. There is obviously a ton of short interest on the dollar which should create a massive short squeeze. You can bet that the institutions have made some pretty large bearish bets on the dollar by buying commodities. In addition, to the retail investor the only option to shorting the dollar is UDN, which barely moves and is not leveraged. Therefore you can bet any retail investors who are trying to play the dollar are in the commodities. If there is a short squeeze all commodities will see an equal effect on the downside.

TD Sequential


Charted above is the SPX Cash Index and the Nasdaq E-mini. Both have posted 13's on the weekly. On the daily (top picture) the SPX posted a TD Setup 9 to coincide with this weekly 13. This is just further evidence that the top may be in.

1987 Market Crash vs 2009 Market Rally


1987 TD Sequential


Wednesday, October 21, 2009

Another Possible Reversal Day

S&P E-Minis


Yesterday I posted stating that the /ES had been forming a series of upward tails in combination with market breadth diverging downwards. Today's market action played into this scenerio yet again, on the S&P E-mini we formed another candle with a tail and a pretty bearish close.

SPX Cash Index


The SPX cash index looks a lot more bearish. We have formed what is called a bearish outside day reversal, when prices reach higher highs then yesterday and then end up closing below yesterday's low. The last time we had this occur was 09/23/09 and we all know what happened there. Its amazing how similar this month has looked compared to the last. We had huge drops on the 1st of the month, slowly rallied up to make new highs, "broke out" of the last trendline resistance (blue line charted above), drifted sideways with downward volume picking up, posted bearish outside day reversal patterns, and then sold off (assuming this occurs tomorrow or Friday). It seems this last rally was pushed higher by gaps higher in earnings. However not everything participated and made new highs.

Dow Transports


Dow Transports never confirmed the Industrials new high and had a huge selloff today fueled mostly by the Airlines. You cannot look at that chart and say it looks bullish whatsoever, looks like a clear double top to me.

The Dollar


I won't go over the VIX because it was already covered in a previous post, however the dollar is due to breakout here sooner or later. It is sitting right at support, making what Elliott Waver's believe to be its last moves before a major rally. If this market can go down today with the dollar going down, just wait until [if] the dollar starts to pick up some steam. Tomorrow I would like to see a rally to confirm a push lower in equities.

1938 vs 2009 


Two posts ago, I mentioned how I would like to see the NDX-100 futures hit its 61.8% retracement. I was hoping that the target was hit but after yesterday's post it appeared as if we hit some resistance. Although I was looking for a bit more upside, I believe that scenario is thrown out the window unless we see the highs of today taken out by the end of the week.Although it doesn't chart as nicely, if you pull up the NDX-100 Index (charted above) you will see we came within 0.30 of the 61.8% retracement (1780.83 vs 1781.13). Thats good enough for me. I believe this is a huge development and it plays out nicely for the bears. Charted above is the NDX-100 vs the Dow Jones Industrials of 1937-38. The 1938 retracement rally came up to the 61.8% retracement before heading lower. In addition the SPX of 1938 went to its 50% retracement, which is pretty similar to what has occurred in today's market as well. In addition if you match up the march lows in both charts, our high was supposed to come in around 10/18/2009. So time and price match up on the weekly scale.

Cycle Chart


Here is an update of the cycle chart I posted. When I originally posted I mentioned this chart has defined many of the major key reversal dates in the market. The only one that didn't work to perfection was last May. It happened to mark a high but prices quickly rallied higher to the major bear trendline charted above in red. This happened to be the ending of Wave 2 of Primary Wave 1.It is possible that we are nearing the end of Primary Wave 2, and today's date would play in perfectly for a similar scenario to play out.  There has already been some talk of this important fractal within the Elliott Wave community. It is funny I can remember being pretty bullish on Apple during last April/May, after what I had thought had been a pretty significant decline in the indicies. They ended up posting good earnings along with Google and both stocks seemed pretty bullish at the time. Soon after, a high was made and Apple never looked back, and the market sent it to $78 a share. Now prices are even higher than last May after even better earnings, but it may be time for it to go back down again.

Lubrizol Update


LZ which has been my short candidate that I've been covering has really underperformed in the past week. It broke its trend and could not regain it. This does not mean a breakdown yet, but the trend has slowed. A possible double top might be occuring. Huge resistance is defined by the red line. If prices started drifting below there it might be time to start a position.


On one last note, I forgot to look at Sequential today to see where we are at on the count. I should have an update on how the indicators look tomorrow.

-MarketMike
StockJockz.blogspot.com

A look at the VIX


Notice the blue support line and how the VIX has bounced FIVE times off of that level. We are quickly approaching that point again. Also, the downtrend has seen 1,2,3,4 waves down already and so the 5th wave down would reach the blue support line and then we could see a turn around. Finally take a look at the sudden reversal in the Stochastic indicator which is now reaching all time oversold levels (The chart does not show trading levels - when I say "oversold" I mean the bearish momentum is very low).

-Wown
StockJockz.blogspot.com

Tuesday, October 20, 2009

Interesting Development in the Futures


Tails on a candlestick usually help define a rejection in price. Consecutive candlesticks with tails give an even stronger signal. The chart above is the S&P E-Mini Futures Contract. The S&P Cash Index does not look similar. In fact the S&P Cash looks like it is perhaps consolidating, however the tails on the Futures hint that a top is near as prices have found resistance. This signal has worked since the rally began. Also to note is divergence in the indicators. Recent breadth has broken down after failing to make a new high despite prices doing so. When I first made this indicator I stated it seemed to point out when a rally is beginning to reverse and starts heading down before price does. Lets see if this does occur because this will be the first time this has happened since I've developed the indicator.

With all of this said, I still think the market has room to run. I really like the chart I posted last night of the Nasdaq Futures. If we can somehow manage to reach that 61.8% retracement on the Nasdaq while maintaining a string of tails on the /ES I believe that would be a gift for bears. That would be the perfect scenerio. Another scenerio I could see would be prices slowly drift down 30-40 points a day, perhaps maintening doji type formations, and then we have a strong down day, perhaps as early as friday. But now I'm just pulling strings. So lets see what happens. I will stick with Elliott Wave one last time and say that our next pullback like the one we saw in the beginning of this month, will be the real deal and we will see 900 before we see 1200.

Monday, October 19, 2009

Market Update: A Look at the Nasdaq Futures

Apple came out with a ~21% surprise in earnings, enough to push it to all time new highs. As if the stock going from $78.2 to $192.32 wasn't enough to say that Apple will have great earnings, wall streets love child is now pushing levels above $202 after hours.


The chart above is the Nasdaq 100 Futures Contract. I've highlighted where the Fibonacci retracements have served as resistance and support in the past. In fact this looks a lot better than the S&P's retracement levels. I'm also not a fan of using the same indicators as everyone else as I do not believe the market plays in the favor of the majority. With that said I've already made it known that the 61.8% retracement is my next target for the market. When I originally calculated corresponding target prices, this coincided with 1098 S&P, however the Nasdaq has lagged the S&P since and allowed the S&P to surpass these levels.

There is plenty of other resistance overhead, but this one will be key to watch. Tomorrow should be good day in the markets as S&P futures are up 0.41% at time of writing. However a gap up and a close below the open is a very bearish sign. Lets see what happens tomorrow, it should be very interesting.

Friday, October 16, 2009

Short term outlook on SPY

A few days ago I talked about why the market rally is unsustainable from a fundamental perspective. Here is a chart that shows why I believe the market should see a correction very soon.


At first glance the chart may seem messy but it has a lot of information and I have left ALL the major technical levels on the chart.

Firstly, pretty significant resistance area has been created in the 110.5-111 area which obviously we have not reached yet. If we were to break through this resistance, the next level is between 115-117. Honestly, I do not think this will happen without a correction. My belief is based on the other studies on the chart.

The time studies show that there is a very high probability that by 10/19 the uptrend should reverse. 10/19 is the strongest "time resistance" area on the chart. Even if that area is broken, the next very strong resistance area is 10/23-24. Either way, the time studies are indicating that there should be an end to the uptrend within the next week. Also, following a High-High time cycle, we should see a high between 16-25 days from the previous high. We are already 20 days since the previous high. Clearly, the time studies are indicating a reversal very soon.

Next, the Stochastic indicator has made a double bearish reversal in the overbought zone. This is a very bearish sign and is usually followed by a significant correction. However, if you look back on the above chart to 7/13 to 7/28, the Stoch made multiple bearish reversals and the correction never came. A counter point to this argument is that 7/13 to 7/28 was the middle of wave 1 while we are in wave 5 (see chart). This means that the bearish probabilities are much higher.

Finally, using the breadth studies that Market Mike created, you can see that within the last 2-3 days, the breadth has dropped 10 points. This is indeed very bearish because it means that the number of sellers is increasing significantly. This is NOT accompanied with lower volume (not shown), which gives this bearish indication some conviction.

If we do see a reversal, how far can we expect to go? According to the basic Fib studies, the first support area lies at 101.17. That is a drop of nearly 10%. Based on the high probabilities of a bearish reversal and such a low support level, I have traded a 108/117 2:1 put Back Ratio (see my post about Back ratios for clarification on this).

Here's to hoping the market crashes... Cheers!

- Wown
stockjockz.blogspot.com

10 Different Views of Technical Analysis

This is going to be a lengthy post that attempts to cover a good portion of what I've learned so far in Technical Analysis after doing it for nearly 2 years and how I see it being used in the industry. Technical Analysis is constantly evolving and it is quite evident that there are tons of different methods available to use.

We all have our own preferences and everyone of us have our own way of practicing Technical Analysis. The reason why everyone doesn't use the same indicators is because not one system works on its own.  I believe people unsuccessfully continue to search for the indicator which will give clear buy and sell signals. Not one indicator works 100% of the time, but if you use every tool available to you, I believe Technical Analysis can help increase the odds in your favor.

If there was one indicator that worked then we'd all probably be millionaires by now, or I wouldn't be posting about it on the Internet telling you about it. As people become more aware of Technical Indicators I believe they become less reliable. On the other hand, I believe if enough people look at the same indicator that it will become a self fulfilling prophecy and serve some type of importance. For example, the 20 day simple moving average. I believe this has to be the most widely watched indicator. I guess this is supposed to represent a moving average of 1 months trading. You often hear how prices will "bounce off the 20dma." Why do you think this is? Is 20 some magical number? I believe it has become a psychological level that if prices approach the 20dma that you need to take action. A lot of Technical Analysis is about market psychology, something even I'm still learning myself.

What I'm about to cover are the different 'levels' of Technical Analysis. Please ignore the names that I've given, but just understand the fact that I believe the sophistication of the analysis becomes greater as you continue to read. A lot of this post is going to be able my personal evolution as a Technical Analyst.

1) The Rookie Technician


Tools:
  • Volume Histogram
  • OHLC bars
  • Price overlay: 20,50,200 Simple Moving Averages
This previous discussion leads me into the most basic form of Technical Analysis. I believe anyone who at least attempts Technical Analysis employs these strategies and watches these indicators. This person watches volume to see if its heavy/light and follows trends by looking at the moving averages. They may use the moving averages as support/resistance but more likely would rather look for crosses in the moving averages. I believe we all started here at one point.

2) Basic Support/Resistance Technician


Tools:
  • Candlesticks
  • Horizontal Price Levels
  • Volume Histogram or Volume by Price (not shown)
Using horizontal levels to define support and resistance is very common place. It was very common to hear last year on the media as we continued to go lower that the DJIA was about to test key support at such and such price. They simply pulled up a longer term chart and tried to find extreme lows as I did above. Obviously prices don't come exactly to these price levels all the time, and other times they go further then these price levels. A key to drawing these levels are to try to connect as many closes/opens/lows/highs as you can. This is much easier to construct using a candlestick chart. Using volume is also helpful to identify your pivot points (extreme highs/extreme lows). For example if you see a day with an exceptional amount of volume, it was obviously an important day and prices attracted enough people to take action. You can expect these same price levels will attract investors as they approach again.

3) The Basic Technician


Tools:
  • Colored Volume Histogram
  • Candlesticks
  • Price overlay: 20, 50 Exponential Moving Averages
  • Price overlay: 200 Simple Moving Average
  • Favorite Oscillators: Typically 2 or 3 of the following: RSI (14), MACD (12, 26, 9), Stochastics, ADX/DI, etc.
The Basic Technician takes it a step further and now incorporates a group of basic indicators to assist in his/her trading. Initially they will go by the book and attempt to trade the oscillators as they were originally designed. For example, buy below 30 RSI and sell above 70%. Obviously they come to learn this doesn't always work and they soon come very familiar with other strategies such as divergences and making custom adjustments to the indicators. In addition they gain a basic understanding of candlesticks and employ a faster set of moving averages by using the 20 and 50 Exponential Moving Averages.

4) Trendline Technician


Tools:
  • Trendlines
  • Channels
  • Volume Histogram
By now I've described what I would guess would be about 40-50% of the technicians out there. I believe most people who do basic technical analysis won't go any farther then what I've described so far and are content with just drawing price levels to try to identify areas of support/resistance. However if you are going to be a successful trader it might be useful to incorporate trendlines into your analysis. As I described above,  prices rarely go down to a specific price before deciding its time to reverse. However prices do tend to stay within their trendlines fairly often. The key is drawing the trendlines properly. Using volume combined with price action is very helpful in doing so. Channels are very useful and are used by the most experienced technicians, including those who practice Elliott Wave, to identify both key support and resistance levels at the same time.

5) Pattern Technician


Tools:
  • Trendlines
  • Knowledge of all patterns
  • Volume Histogram
  • Oscillators (not shown)
By definition every technician tries to look for patterns in order to forecast future price movement and I'm sure everyone has visited Investopedia's Chart University at least once. However there is a certain degree of sophistication required to identify true patterns. It takes time to develop the knowledge of patterns, their targets, and signals of a true breakout. Experienced technicians in this area can glance at a chart and immediately point out patterns without giving much thought at all. However as I've said before the more people that know about a specific pattern the more likely it is to fail. I've seen so many head and shoulder's patterns fail recently, so it is important to use other indicators such as oscillators and volume to confirm the price pattern. Also these technicians come up with their own breakout qualifiers and wait for confirmation before taking action.

6) Fibonnaci Forecaster


Tools:
  • A Platform which has all tools available
  • Fibonnaci Arcs, Time Ratios, Retracements, Retracements, Extensions, Fans
  • A knowledge of the Fibonnaci Ratios and Sequence
I believe Fibonnaci is the most important aspect of Technical Analysis and is probably the most helpful in forecasting the markets. The degree of sophistication here is determined in which tools you use and how much time you put into your analysis. A simple retracement is done by everybody, but there are so many other tools available that all base themselves on the Fibonacci ratios that not too many people use. For example I don't read up too much on people using Fibonnaci Arcs but I believe they can still a useful tool. The key is finding the right points to connect to and seeing how the tool has worked in the past. If it played a significant role in the past, probabilities are you can count on it working in the future. For example if you would have drawn the Fibonnaci Arc above and saw that it acted as resistance in March 08 and October 08 you could have kept a close eye on it and done a pretty good job predicting the low in March 09. I came across this Arc yesterday, and it will be important to continue watching it going forward.

7) Elliott Wave 


Tools:
  • Good knowledge of all aspects of Technical Analysis
  • Knowledge of the Wave Patterns and the 3 Rules of Elliott Wave
  • Fibonnaci Tools and Time Ratios
  • Channels
  • Oscillators
  • Volume
  • Divergences
Now that we've moved fairly far down the list we've moved into Elliott Wave which is on the top of my list for  difficulty and sophistication required to perform the analysis. There are only a few good analysts out there who have valid counts but many people pay for this information. I know instititions do follow Elliott Wave despite how subjective it is, because it is evident even in the chart above that it works. Elliott Wave attempts to explain that the market moves in waves bounded by Fibonnaci. For example notice above how corrective wave 4 is 61.8% of the size of corrective wave 2. Also Wave 3 is 123.6% of Wave 1. Although not annotated in the chart above, price projections can be performed in a similar matter.

8) Cycle Forecaster


Tools:
  • Cycle tools
  • Time Ratios
  • Knowledge of Calendar Cycles and Dates
There seems to be tons of indicators available on price since price is what drives your return on an investment. However cycles and precise timing seem to be overlooked and very difficult to find information on. Even I cannot comment too much on this since I have yet to study much on the use of cycles. However there are plenty of services out there that claim they know the dates in which the market will see a turn or begin reversing. Its up to you whether you believe them.

9) Demark Technician

Tools:
  • A valid charting platform
  • Demark Indicators
I recently came across these indicators and there doesn't seem to be much information on the web about them. However I believe enough research has went into the indicators and they work impressively enough to be put in their own category. Developed by Tom Demark, the most popular and probably the most useful is his Sequential timing indicator. Although there has been development through other platforms, I believe the Bloomberg Terminal has the most correct versions. Unfortunately your average investor cannot afford such an expensive tool but you can be sure all the institutions keep an eye on Sequential.


10) Custom Indicators


Tools:
  • A creative mind
  • Programming ability
  • A platform that allows for custom indicators
Everyone out there wants to make money. Some of us are not content with what has been provided and try to  develop our own indicators. Shown above is a version of Guppy MA of which I found somewhere on the web and I apologize ahead of time for not giving credit to who developed it. I believe it does a great job of pointing out the current short term and long term trends. Also I've overlayed a simple Bollinger Band which is another indicator that many people use. Using all indicators in unison can generate positive results.


I've gone through a list of 10 different ways of looking at Technical Analysis, but the truth is there are unlimited ways to analyze the market. Somewhere in between all the discussion above is the analysis of market internals, sentiment, volatility, and so many others. There are also plenty of other indicators and tools that I do not mention because I do not have much familiarity with them. Probably the biggest are the Gann tools and the use of other tools such as Andrew's Pitchfork. Perhaps sometime down the line I can include them in this post after I've had some experience with them.

Wednesday, October 14, 2009

Market Update: A Look at the Major Index Charts


Dow Jones Industrial Average:
With the Industrials now above 10k and the S&P breaking previous highs of 1081.15 we now have to look for the next area where prices will begin to start reversing. Here is a chart of the DOW showing some major resistance overhead including the 50% retracement and probably the best way to draw the major downward trendline form the highs.


Dow Jones Transportation Average:
Still plenty of room to go until new highs. Has some pretty significant resistance to overcome to get there.


S&P 500 Index:
Upside appears limited. If I had to make a call, I'd say we have a slightly positive day tomorrow and a reversal start Friday.


Nasdaq 100:
I believe this is the key chart to watch. Plenty of resistance overhead including a major 61.8% retracement.


Nasdsaq Composite Index: